
SWISS MARKET INDEX – Elliott Wave Analysis | Trading Lounge Day Chart
SWISS MARKET INDEX Wave Technical Analysis
FUNCTION: Trend
MODE: Impulsive
STRUCTURE: Navy blue wave 1
POSITION: Gray wave 3
DIRECTION NEXT LOWER DEGREES: Navy blue wave 2
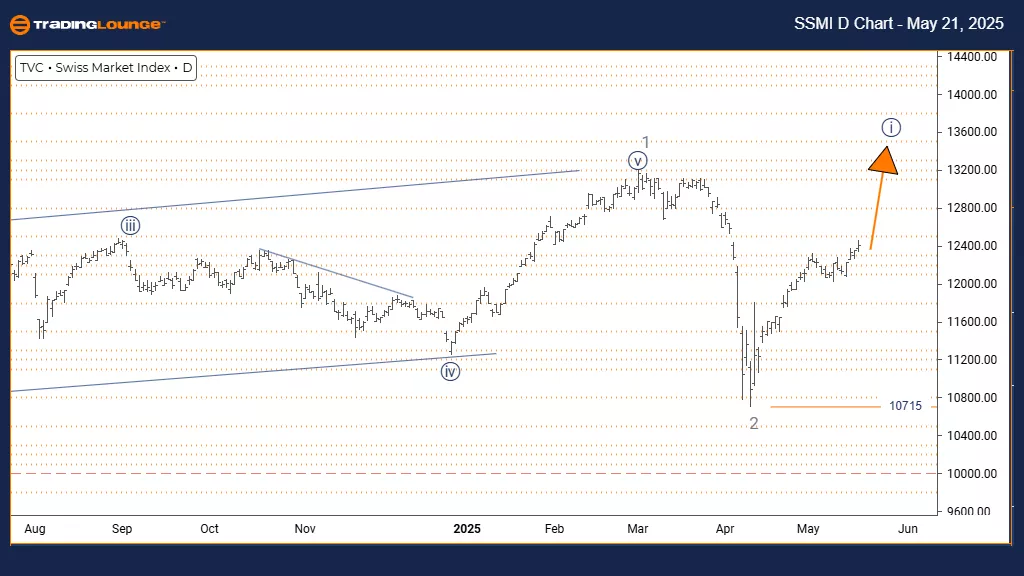
DETAILS: Gray wave 2 appears complete; navy blue wave 1 of 3 is in motion.
Invalidation Level: 10715
The Swiss Market Index (SMI) daily chart shows strong upward momentum within an existing bullish trend. The wave structure indicates navy blue wave 1 is forming as part of gray wave 3, following the completion of gray wave 2's correction. This signals the early phase of a potential extended bullish move.
The transition into navy blue wave 1 has begun, supported by significant buying pressure. As this impulse wave develops within gray wave 3, further upside potential is expected. However, the wave count becomes invalid above the critical level of 10715.
This analysis helps traders and investors understand the index’s position in its broader trend. With navy blue wave 1 in progress, the next likely phase is navy blue wave 2—a corrective move. Traders should monitor for continued bullish signals and be prepared for eventual retracement.
SWISS MARKET INDEX – Elliott Wave Analysis | Trading Lounge Weekly Chart
SWISS MARKET INDEX Wave Technical Analysis
FUNCTION: Trend
MODE: Impulsive
STRUCTURE: Gray wave 3
POSITION: Orange wave 3
DIRECTION NEXT HIGHER DEGREES: Gray wave 3 (ongoing)
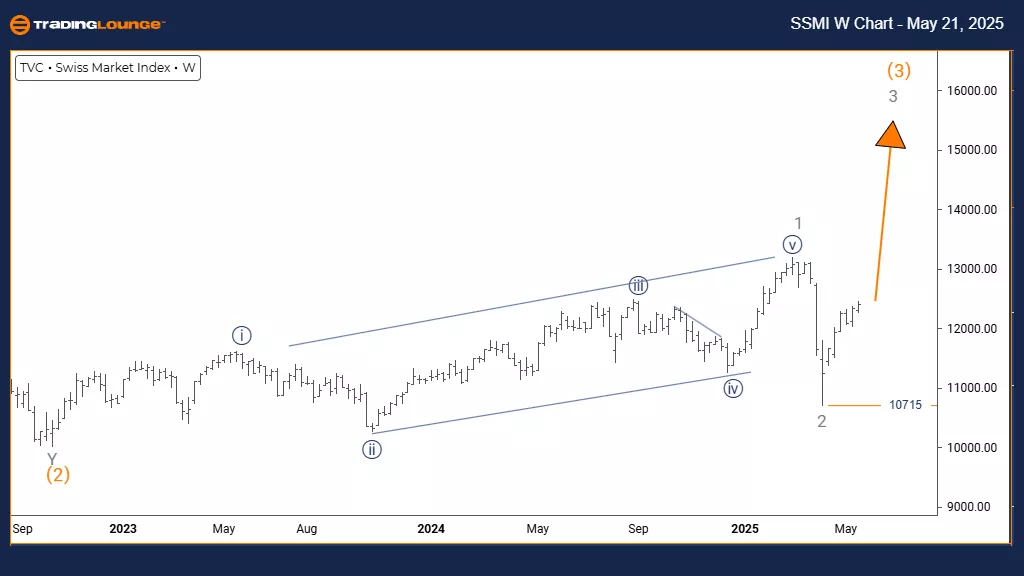
DETAILS: Gray wave 2 appears complete; gray wave 3 is underway.
Invalidation Level: 10715
The weekly chart shows a strong bullish outlook for the SMI, with impulsive characteristics evident. Gray wave 3 is forming within a broader structure identified as orange wave 3, confirming gray wave 2's completion and a move into the strongest segment of the bullish trend.
This phase is typically the most dynamic, often bringing extended gains. Institutional buying is evident, and the positioning within orange wave 3 supports potential for significant market movement.
This framework helps investors grasp the long-term direction of the SMI. The index is currently in a favorable position for further upside. While impulse waves eventually correct, gray wave 3's development signals a potentially lengthy and profitable trend continuation.
Technical Analyst: Malik Awais
More By This Author:
Elliott Wave Technical Analysis: Bitcoin Crypto Price News For Wednesday, May 21
Elliott Wave Technical Forecast: Cochlear Limited - Tuesday, May 20
Elliott Wave Technical Analysis: Texas Instruments Inc. - Tuesday, May 20


Comments
Log in or sign up to join the conversation.