
Elliott Wave Technical Analysis - Indian Stocks: Nifty 50 Index
NIFTY 50 INDEX Elliott Wave Analysis Trading Lounge Day Chart
NIFTY 50 INDEX Elliott Wave Technical Analysis
FUNCTION: Bullish Trend
MODE: Impulsive
STRUCTURE: Navy Blue Wave 1
POSITION: Gray Wave 1
DIRECTION NEXT LOWER DEGREES: Navy Blue Wave 2
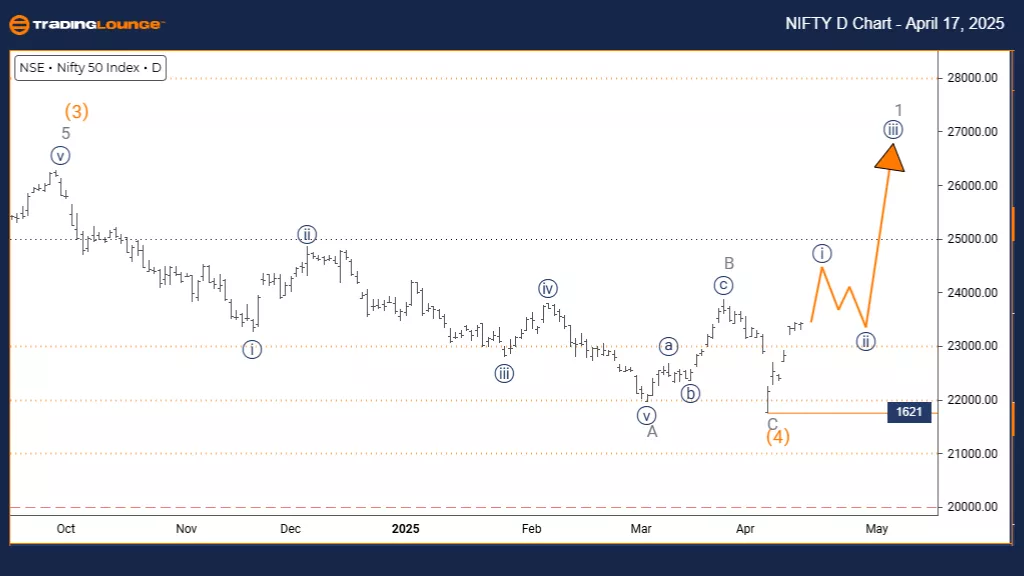
DETAILS: Orange Wave 4 appears complete. Navy Blue Wave 1 of Gray Wave 1 is now in progress.
Wave Cancel Invalid Level: 1621
The NIFTY 50 Index daily chart shows a bullish trend emerging within an impulsive Elliott Wave structure. The recent completion of orange wave 4 signals the beginning of navy blue wave 1, which is developing inside the broader gray wave 1 framework. This formation marks the start of a new impulse sequence that may carry the market higher in upcoming sessions.
Navy blue wave 1 begins this trend and usually represents the phase where market momentum starts to build. Although wave 1 typically exhibits steady but moderate growth, it sets a crucial foundation for stronger movements in later waves. This structure suggests the upward trend is developing gradually and may progress before the next pullback occurs.
The expected next step is navy blue wave 2, a corrective wave likely to follow once wave 1 completes. This could offer a retracement opportunity before the bullish trend resumes in wave 3. A critical support level to monitor is 1621. A break below this point would invalidate the current wave count and call for a reevaluation.
On the daily chart, the current impulse wave outlines the basis for new bullish momentum. Traders should track typical wave 1 characteristics such as rising volume and stable price increases, while noting that this wave often lacks the intensity of wave 3. This phase may offer a calculated entry for bullish setups.
As the market transitions into gray wave 1 on a higher degree, this suggests a potential build-up toward more powerful trend moves. Positioning during this early stage may benefit from close observation of momentum indicators and price behavior to confirm the wave structure and signal the start of wave 2.
NIFTY 50 INDEX Elliott Wave Analysis Trading Lounge Weekly Chart
NIFTY 50 INDEX Elliott Wave Technical Analysis
FUNCTION: Bullish Trend
MODE: Impulsive
STRUCTURE: Gray Wave 1
POSITION: Orange Wave 5
DIRECTION NEXT LOWER DEGREES: Gray Wave 1 (Started)
DETAILS: Orange Wave 4 appears completed. Gray Wave 1 of 5 is currently in play.
Wave Cancel Invalid Level: 1621
The NIFTY 50 Index weekly chart indicates a bullish trend forming through an impulsive Elliott Wave pattern. With orange wave 4 now completed, the index has entered gray wave 1, which is part of the broader orange wave 5 structure. This development marks the beginning of what could be the final bullish leg before a more extensive market correction sets in.
Gray wave 1 serves as the first phase of this final upward movement. Typically, it displays building momentum as the market rallies in preparation for the trend's conclusion. The completion of orange wave 4 sets the tone for this wave, which often lifts prices meaningfully before wave 5 completes. Current chart signals support continued upward action before another correction phase begins.
The weekly timeframe provides critical insight into the late-stage structure of this bullish move. With orange wave 5 underway at a higher degree, this current leg may represent the final surge in the ongoing uptrend. This positions the index in an important phase for intermediate-term investors and swing traders.
Participants should monitor gray wave 1 for its usual characteristics, such as steady price increases and gradually growing volume. The invalidation level to watch remains at 1621. If the price falls below this level, the wave count would no longer be valid and require reevaluation. This level acts as strong technical support and guards the prior wave's low.
This analysis encourages maintaining a bullish stance while being alert to potential volatility as the structure matures. Traders should look for traditional wave termination signs, such as momentum divergence or reversal patterns. Technical indicators and price action will be key in confirming the transition from wave 1 to the next phase.
The current setup offers a significant opportunity to engage in what may be the final portion of this broader bullish structure. Close observation of price action and trend signals will help confirm when this wave completes and transitions. The weekly view underlines the importance of this pattern for intermediate-term strategy and planning.
Technical Analyst: Malik Awais
More By This Author:
Elliott Wave Technical Forecast: Block, Inc. - Thursday, April 17
Elliott Wave Technical Analysis: Euro/U.S. Dollar - Thursday, April 17
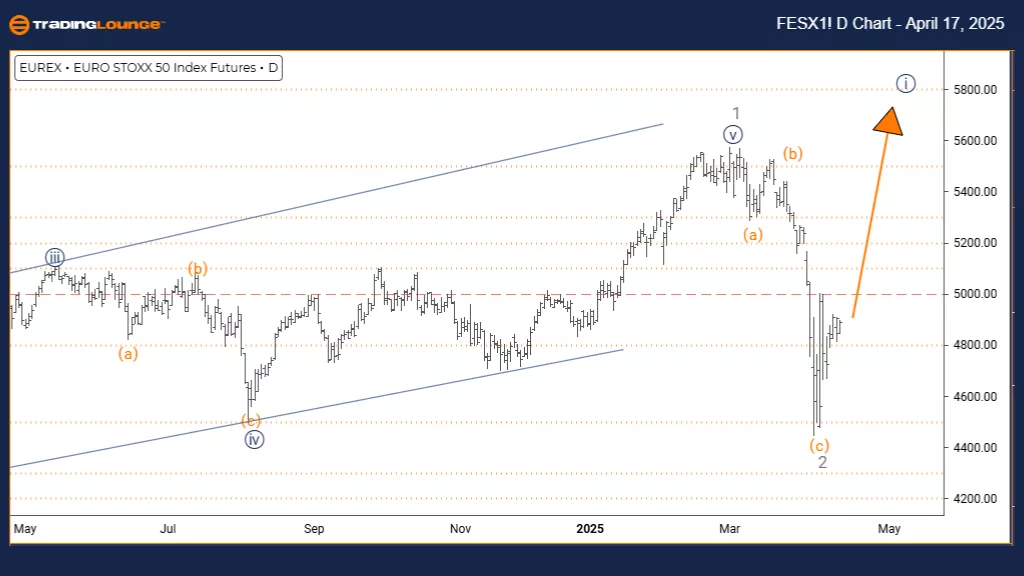
Elliott Wave Technical Analysis: Euro Stoxx 50 Index - Thursday, April 17
At TradingLounge™, we provide actionable Elliott Wave analysis across over 200 markets. Access live chat rooms, advanced AI & algorithmic charting tools, and curated trade ...
more

