
GBPUSD Elliott Wave Analysis Trading Lounge Day Chart, Monday, Sept.18

GBPUSD Elliott Wave Technical Analysis
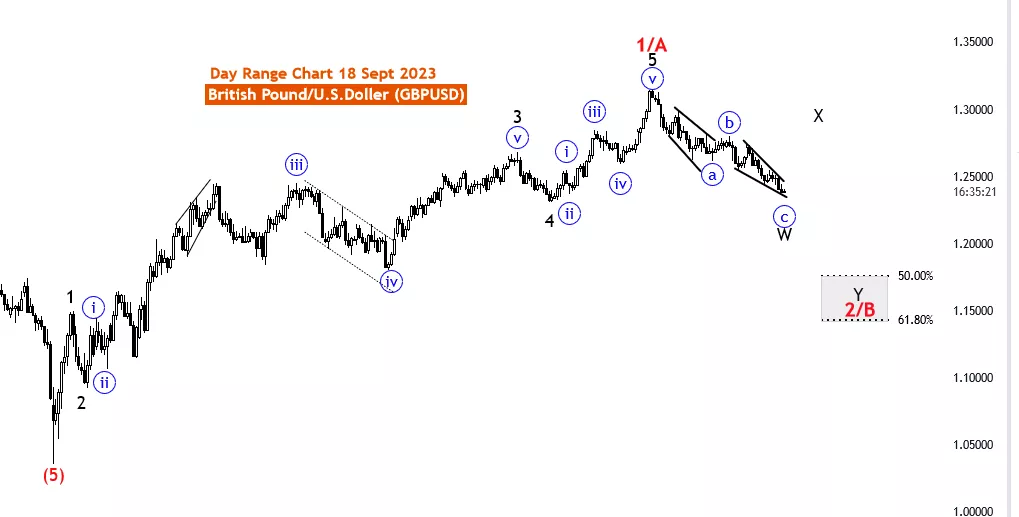
Function: Counter Trend
Mode: corrective
Structure: wave C of W
Position: W of 2/B
Direction: Next higher Degrees: X of 2/B
Details: Wave C of W as ending diagonal in play and near to end, after that wave X expected. Wave Cancel invalid level: 1.31451
The GBPUSD Elliott Wave Analysis for 18 September 23, provides insights into the Day Chart of the British Pound/U.S. Dollar (GBPUSD) currency pair. Employing the Elliott Wave theory, this analysis seeks to elucidate potential market movements with a focus on a broader time frame.
The Function identified in this analysis is "Counter Trend." This indicates that the primary objective is to discern potential corrective movements within the market. Counter-trend analysis seeks to capitalize on price retracements or corrections against the dominant trend.
The Market Mode is labeled as "corrective," suggesting that the market is presently engaged in a corrective phase rather than displaying strong impulsive movements. Corrective phases are characterized by price movements that oppose the prevailing trend, often presenting trading opportunities when the correction is concluded.
The Market Structure is specified as "wave C of W," signifying that the analysis is scrutinizing wave C within the larger corrective pattern labeled W. Understanding the specific wave within a corrective pattern aids traders in identifying potential price movements and reversal points.
The Position within the Elliott Wave pattern is identified as "W of 2/B." This implies that the analysis is focused on the W wave within the broader corrective pattern known as 2/B. Traders can use this information to gauge their position within the overall corrective pattern.
Regarding the Direction Next Higher Degrees, the analysis proposes "X of 2/B" as the possible next phase of development. This suggests that following the completion of wave C, the market may transition into wave X within the overarching corrective pattern.
The analysis provides specific Details, stating that "wave C of W" is currently in play and nearing its conclusion. Following this, the market anticipates a wave X. Furthermore, it highlights the "Wave Cancel invalid level" at 1.31451, which serves as a crucial reference point for traders.
In summary, the GBPUSD Elliott Wave Analysis on 18 September 23, concentrates on potential corrective movements within the GBPUSD currency pair, utilizing the Function, Mode, Structure, Position, and Direction to guide traders in making informed decisions. Traders are encouraged to combine this analysis with other technical and fundamental indicators while practicing prudent risk management in the ever-evolving foreign exchange market.
Technical Analyst : Malik Awais
More By This Author:
Tech Stock Report: AAPL, AMZN, NVDA, TSLA, GOOGL, META, NFLX, MSFT - Sept. 17
Elliott Wave Technical Analysis: KLA Corporation
Elliott Wave Technical Analysis Day Chart - Australian Dollar/Japanese Yen


Comments
Log in or sign up to join the conversation.