
KLA Corporation., Elliott Wave Technical Analysis
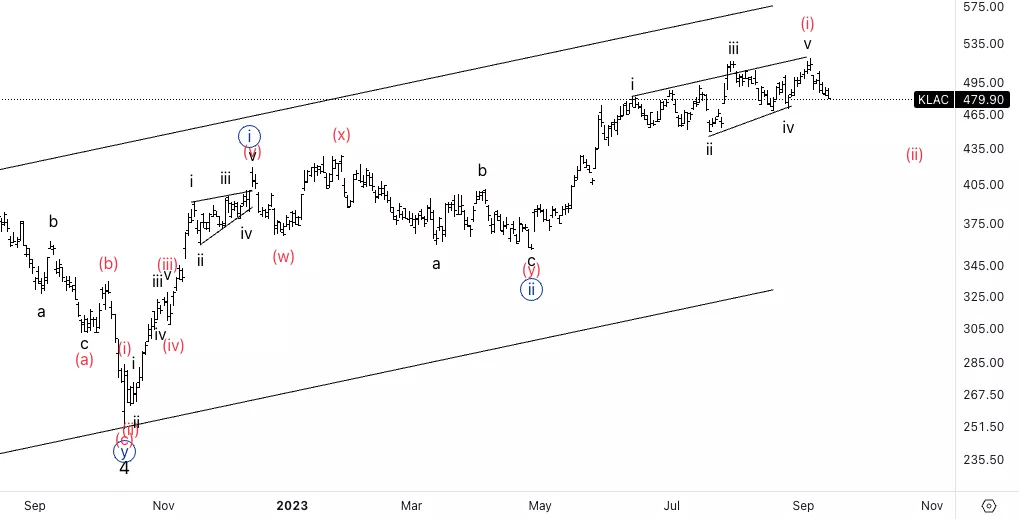
KLA Corporation., (Nasdaq: KLAC): Daily Chart 15 September 2023
KLAC Stock Market Analysis: We have been monitoring this stock for quite some time as we expected continuation higher within wave {iii}. Looking for a potential leading diagonal in wave (i) of {iii} to then take off into wave (iii).
KLAC Elliott Wave Count: Wave (ii) of {iii}.
KLAC Technical Indicators: Below 20EMA.
KLAC Trading Strategy: Looking for longs into wave (iii).
Analyst: Alessio Barretta
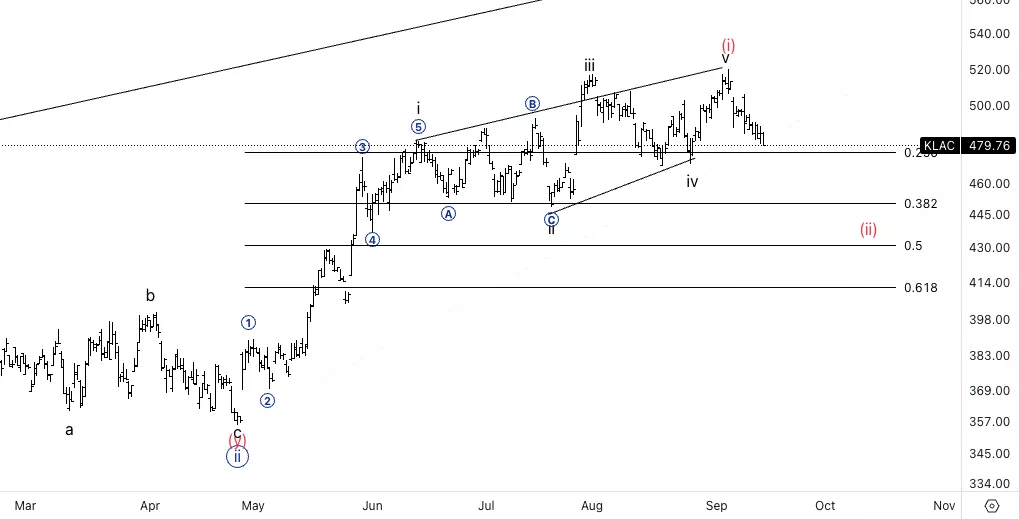
KLA Corporation., KLAC: 4-hour Chart, 15 September 2023
KLA Corporation., Elliott Wave Technical Analysis
KLAC Stock Market Analysis: Looking for wave (ii) to end near the wave ii of the diagonal at around 450$, which would also correspond to then 38.2% of the pullback in wave (ii).
KLAC Elliott Wave count: Wave a of (iii).
KLAC Technical Indicators: Below 20EMA.
KLAC Trading Strategy: Looking for longs into wave (iii).
More By This Author:
Elliott Wave Technical Analysis - Etheruem/U.S. Dollar
Elliott Wave Technical Analysis 4 Hour Chart - AUDJPY
Bullish Momentum In Leading Stocks And US Sectors


Comments
Log in or sign up to join the conversation.