

Image Source: Unsplash
AUDJPY Elliott Wave Analysis Trading Lounge Day Chart, 15 September 2023
Australian Dollar/Japanese Yen (AUDJPY) Day Chart
AUDJPY Elliott Wave Technical Analysis
Function: Counter Trend
Mode: corrective
Structure: likely zigzag
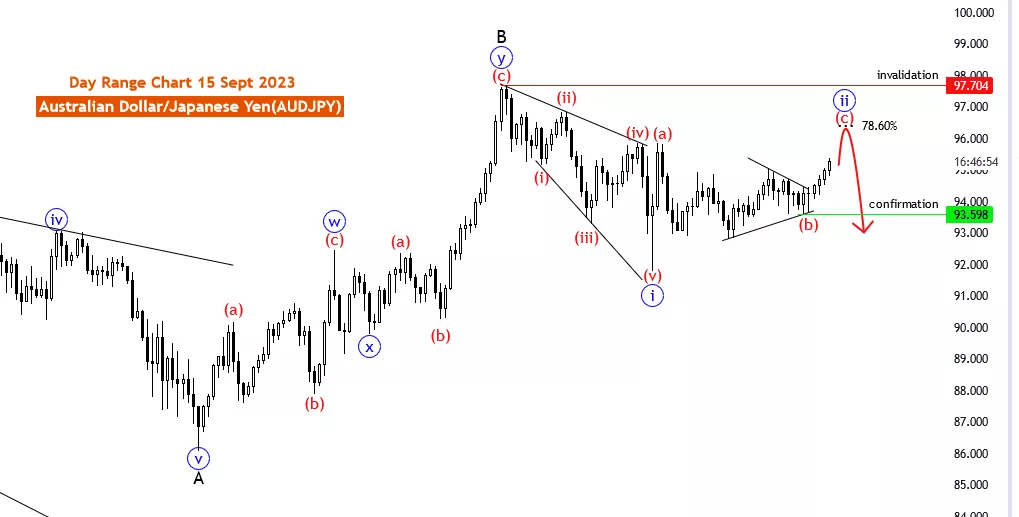
Position: wave 2 of C
Direction Next lower Degrees: wave (3 of C)
Details: Red wave C of blue corrective wave 2 in play. Confirmation level for blue wave 3 at 93.598. Wave Cancel invalid level:97.704
The AUDJPY Elliott Wave Analysis for 15 September 23, is conducted on the daily chart of the Australian Dollar/Japanese Yen (AUDJPY) currency pair. This analysis employs the Elliott Wave theory to provide traders with insights into potential market movements over a longer time frame.
The primary Function of this analysis is identified as "Counter Trend." This suggests that the analysis is primarily concerned with identifying potential corrective movements within the market. Counter-trend trading aims to take advantage of price retracements or corrections within the context of the broader trend.
The Mode of the market is categorized as "corrective," indicating that the market is currently in a phase of correction rather than a strong impulsive move. Corrective phases are characterized by price movements that oppose the prevailing trend, often presenting trading opportunities when the correction is complete.
The market Structure is described as a "likely zigzag." A zigzag is a specific corrective pattern in the Elliott Wave theory, consisting of three waves labeled A, B, and C. Understanding the likely structure helps traders anticipate price movements within the corrective wave.
The Position within the Elliott Wave pattern is defined as "wave 2 of C." This means that the analysis is focused on the second wave within the corrective structure labeled C. Traders can use this information to gauge where they are within the overall corrective pattern and plan their trades accordingly.
In terms of the Direction Next Lower Degrees, the analysis points to "wave (3 of C)" as a potential development. This suggests that, following the completion of wave 2 of C, the market may transition into the third wave of the corrective pattern. Identifying such wave transitions is crucial for traders as they often signify strong price movements.
The analysis provides specific Details, indicating that "Red wave C of blue corrective wave 2" is currently in play. It also mentions the confirmation level for the start of "blue wave 3" at 93.598. This level is significant for traders looking to confirm the commencement of the next wave.
To summarize, the AUDJPY Elliott Wave Analysis for 15 September 23, focuses on potential corrective movements within the AUDJPY currency pair. Traders should consider the Function, Mode, Structure, Position, and Direction to make informed trading decisions, and it's essential to combine this analysis with other technical and fundamental indicators while practicing sound risk management.
More By This Author:
Bullish Momentum In Leading Stocks And US Sectors
Elliott Wave Technical Analysis: Spotify Inc. - Thursday, Sept. 14
Elliott Wave Technical Analysis: Monero/U.S. Dollar - Thursday, Sept. 14


Comments
Log in or sign up to join the conversation.