Elliott Wave Technical Analysis: Spotify Inc. - Thursday, Sept. 14
Spotify Inc., Elliott Wave Technical Analysis
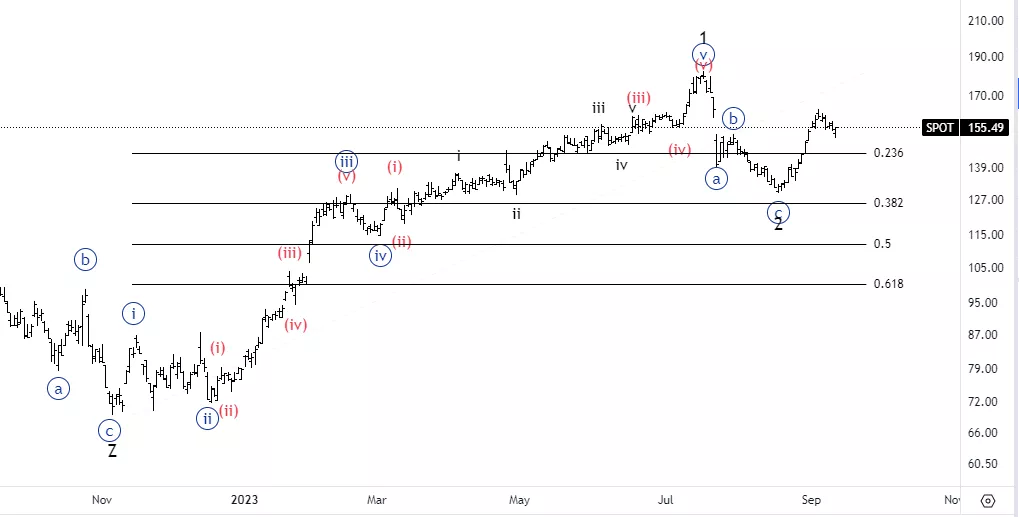
Spotify Inc., (NYSE: SPOT): Daily Chart, 14 September 2023
SPOT Stock Market Analysis: After an over 100% move to the upside, we have seen a sharp correction which was identified as either a wave 2 or B. At this point, as we begin to resume higher, breaking the previous wave {b}, there is a possibility for at least five more waves to the upside.
SPOT Elliott Wave Count: Wave 3 of (A).
SPOT Technical Indicators: Below all averages.
SPOT Trading Strategy: Looking for longs into wave 3.
Analyst: Alessio Barretta

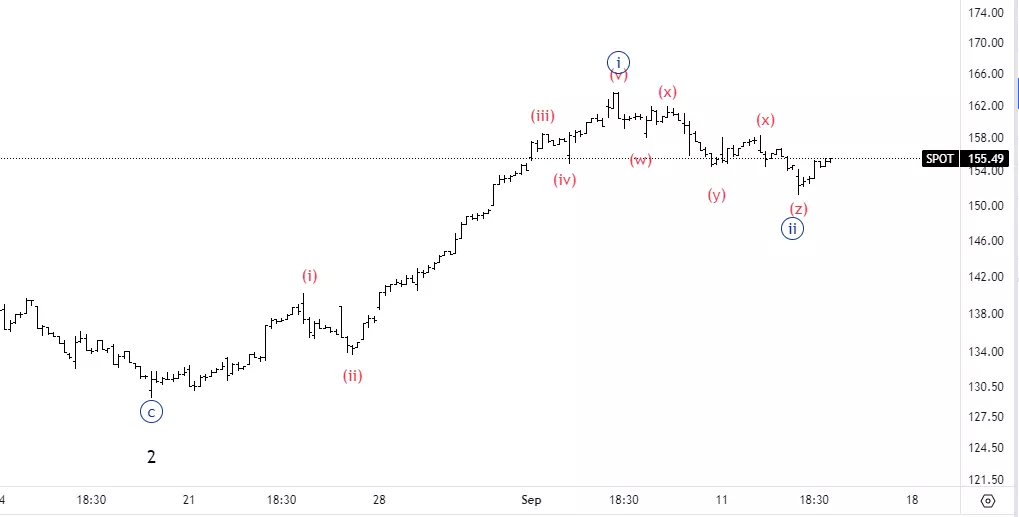
United Parcel Service Inc., SPOT: 1-hour Chart, 14 September 2023
United Parcel Service Inc., Elliott Wave Technical Analysis
SPOT Stock Market Analysis: Here’s a closer look at the advanced we’ve seen into potential wave {i}, as there seems to be a case for five waves to the upside, making the up move impulsive.
SPOT Elliott Wave count: Wave {ii} of C.
SPOT Technical Indicators: In between averages.
SPOT Trading Strategy: Looking for longs on the way up into wave {c}.

More By This Author:
Elliott Wave Technical Analysis: Swiss Franc, Thursday, Sept. 14 - Day Chart
Elliott Wave Technical Analysis: Swiss Franc, Thursday, Sep. 14 - 4 Hour Chart
U.S. Stocks Report - Elliott Wave Analysis
Analyst Peter Mathers TradingLounge™ Australian Financial Services Licence - AFSL 317817


