
USD/CHF Elliott Wave Analysis Trading Lounge Day Chart, Thursday, Sep. 14
U.S.Dollar/Swiss Franc (FXF) Day Chart
USD/CHF Elliott Wave Technical Analysis
Function: Trend
Mode: impulsive
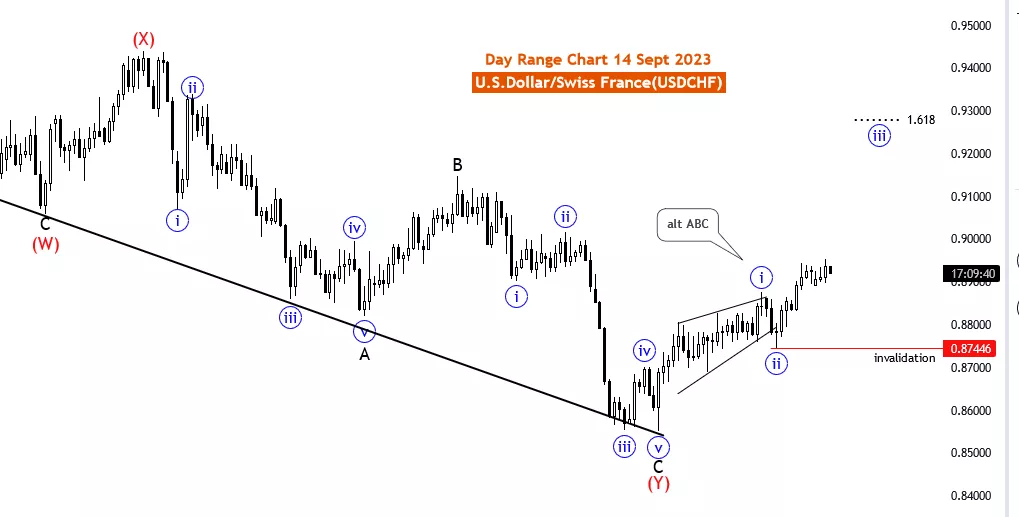
Structure: blue wave 3 of black wave 1
Position: New Black Wave 1
Direction Next lower Degrees: wave (4 of 1)
Details: After blue wave 2 blue wave 3 is in play and expected to go higher. Wave Cancel invalid level: 0.87446
The USD/CHF Elliott Wave Analysis for 14 September 23, is conducted on the daily chart of the U.S. Dollar/Swiss Franc (USD/CHF) currency pair. This analysis employs the Elliott Wave theory to provide traders with insights into potential market movements.
The primary Function of this analysis is identified as "Trend." This suggests that the primary goal is to ascertain and comprehend the prevailing market direction. Understanding the current trend is essential for traders as it forms the basis for their trading strategies.
The Mode of the market is characterized as "impulsive," indicating that the market is presently undergoing robust and decisive price movements. Impulsive phases are noteworthy for trend-following traders, as they often indicate substantial and sustained price movements in the direction of the trend.
The Structure of the market is described as "blue wave 3 of black wave 1." This signifies that the analysis is focused on a specific wave within the Elliott Wave pattern, specifically the third wave within the first major wave. Identifying the particular wave structure aids traders in pinpointing potential entry and exit levels.
The Position within the Elliott Wave pattern is defined as "New Black Wave 1." This suggests that the market may have initiated a new wave within the broader Elliott Wave structure. Recognizing the market's position within the wave pattern assists traders in anticipating potential price movements and trend continuations.
Regarding the Direction Next Lower Degrees, it is implied that "wave (4 of 1)" may be in play. This suggests the possibility of a corrective wave (4) occurring within the context of the larger black wave 1. Corrective waves often offer trading opportunities for traders seeking to enter or exit positions.
In summary, the USD/CHF Elliott Wave Analysis for 14 September 23, furnishes traders with insights into prospective trend-following movements in the USD/CHF currency pair. By considering the Function, Mode, Structure, Position, and Direction, traders can acquire a comprehensive grasp of the market's dynamics. Nevertheless, traders should complement this analysis with other technical and fundamental indicators and adhere to effective risk management strategies when making trading decisions.
More By This Author:
U.S. Stocks Report - Elliott Wave Analysis
Elliott Wave Technical Analysis: United Parcel Service Inc. - Wednesday, Sept. 13
Elliott Wave Technical Analysis Day Chart - British Pound/Australian Dollar


Comments
Log in or sign up to join the conversation.