

Image Source: Pixabay
GBPAUD Elliott Wave Analysis Trading Lounge Day Chart, 13 September 2023
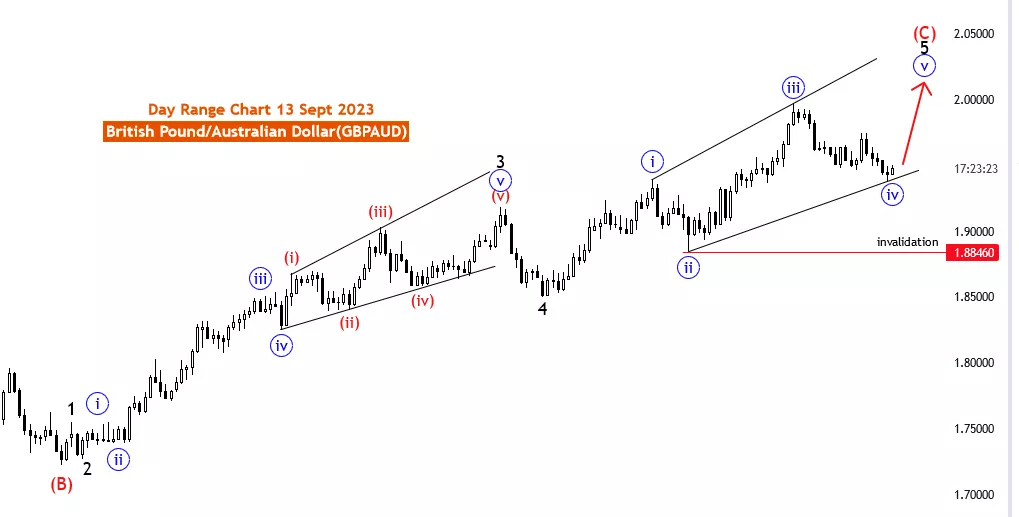
British Pound/ Australian Dollar (GBPAUD) Day Chart
GBPAUD Elliott Wave Technical Analysis
Function: Trend
Mode: impulsive
Structure: Ending diagonal in black wave 5
Position: Red wave C
Direction Next higher Degrees: blue wave 5 may started
Details: blue corrective wave 4 of diagonal looking completed ,now blue wave 5 started. Wave Cancel invalid level: 1.88460
The GBPAUD Elliott Wave Analysis for 13 September 23, focuses on the daily chart of the British Pound/Australian Dollar (GBPAUD) currency pair. This technical analysis employs Elliott Wave theory to provide traders with insights into potential market movements.
The Function of this analysis is identified as "Trend," indicating its primary purpose is to ascertain the prevailing market direction. Understanding the current trend is fundamental for traders as it guides their trading decisions.
The Mode is described as "impulsive," suggesting that the market is currently experiencing strong and decisive price movements. Impulsive modes are crucial for trend-following traders as they often signify significant price trends.
The Structure of the market is defined as an "Ending diagonal in black wave 5." Ending diagonals are a specific Elliott Wave pattern that can signal the conclusion of a trend or the potential for a reversal. Traders closely monitor such patterns for clues about future market movements.
The Position within the Elliott Wave pattern is identified as "Red wave C." Understanding the market's position within the broader wave pattern is essential for traders, as it helps them anticipate potential price movements.
The Direction Next Higher Degrees indicates that blue wave 5 may have started, suggesting a possible continuation of the current trend or the final stages of the ending diagonal pattern. This insight is valuable for traders looking to position themselves effectively in the market.
In summary, the GBPAUD Elliott Wave Analysis for 13 September 23, offers traders valuable information about potential trend-following movements in the GBPAUD currency pair. By examining the Function, Mode, Structure, Position, and Direction, traders can gain a comprehensive understanding of the market's dynamics. However, it's crucial to complement this analysis with other technical and fundamental indicators and apply sound risk management strategies when making trading decisions.
More By This Author:
Elliott Wave Technical Analysis: Okta Inc. - Tuesday, Sept. 12
Elliott Wave Technical Analysis EUR/USD Hour Chart - Tuesday, September 12
Elliott Wave Technical Analysis: Tron/U.S. Dollar - Tuesday, Sept. 12


Comments
Log in or sign up to join the conversation.