
Okta Inc., Elliott Wave Technical Analysis
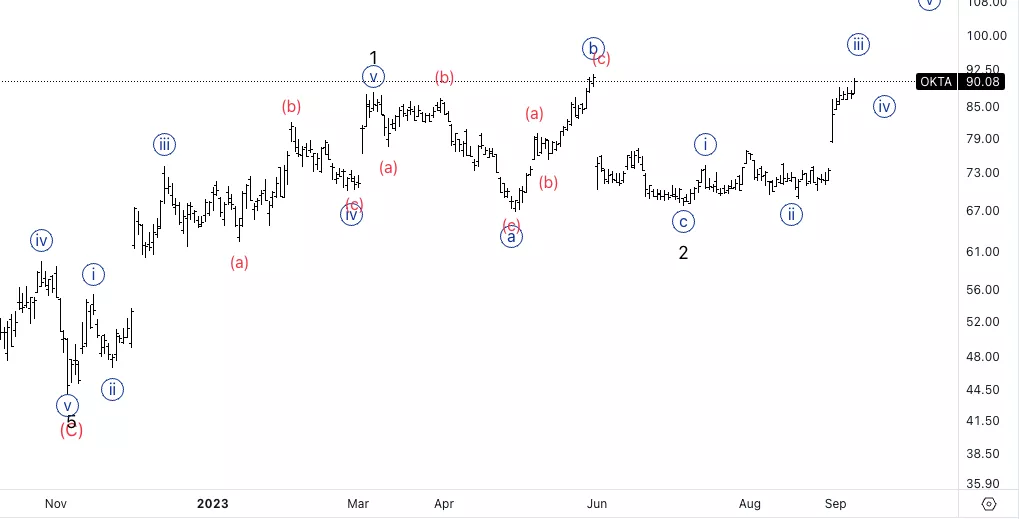
Okta Inc.,(Nasdaq: OKTA): Daily Chart, 12 September 2023
OKTA Stock Market Analysis: We have been looking for upside continuation after a five wave move into wave 1 and sideways consolidation into what could be either wave 2 or B.
OKTA Elliott Wave Count: Wave 2 or B of (A)/(W).
OKTA Technical Indicators: Above all averages.
OKTA Trading Strategy: Looking for longs on the way up into wave {v}.
Analyst: Alessio Barretta
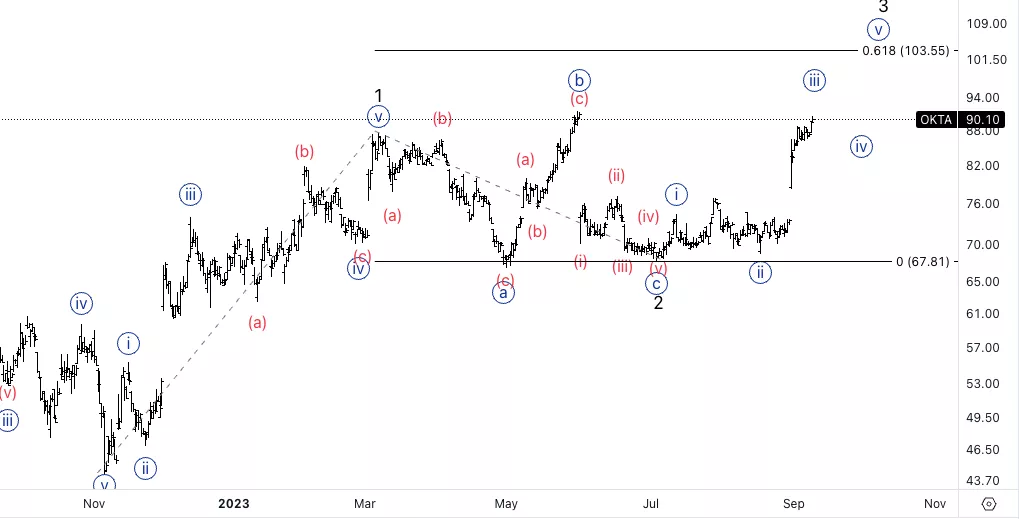
Okta Inc., OKTA: 4-hour Chart, 12 September 2023
Okta Inc., Elliott Wave Technical Analysis
OKTA Stock Market Analysis: We see how we have exploded higher into wave {iii} with an upside thrust, typical of a wave {iii}. Looking for a potential pullback into wave {iv} to then look for longs. Minimum upside target is 0.618 3 vs. 1 at 104$.
OKTA Elliott Wave count: Wave {iii} of 3/C
OKTA Technical Indicators: Above all averages.
OKTA Trading Strategy: Looking for longs into wave {v}.
More By This Author:
Elliott Wave Technical Analysis Day Chart - Euro/British Pound
Elliott Wave Technical Analysis: Interactive Brokers Group Inc.
Elliott Wave Technical Analysis 4 Hour Chart - Euro/British Pound


Comments
Log in or sign up to join the conversation.