
Coal India Indian Stocks Elliott Wave Technical Analysis
Coal India – Elliott Wave Analysis (Trading Lounge Day Chart)
Coal India Technical Wave Analysis
FUNCTION: Counter Trend
MODE: Corrective
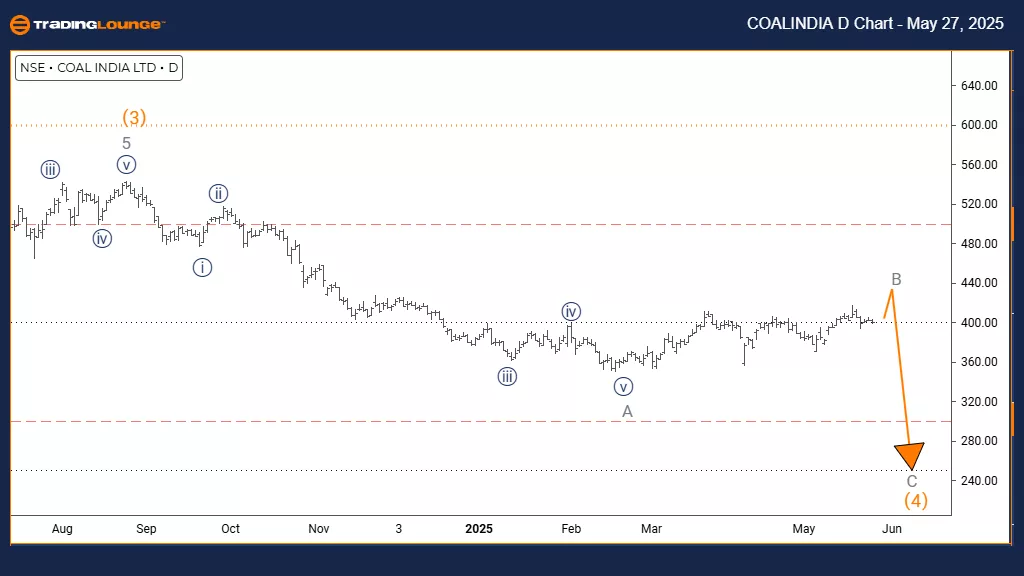
STRUCTURE: Gray Wave B
POSITION: Orange Wave 4
DIRECTION NEXT LOWER DEGREES: Gray Wave C
DETAILS: Gray wave A is likely complete, and gray wave B is now developing.
Market Outlook
Coal India is currently in a corrective phase. The daily chart highlights gray wave B unfolding within orange wave 4. This follows the completion of gray wave A's downward move, placing the stock in a temporary upward retracement within a broader bearish cycle.
Wave Structure Analysis
The transition from gray wave A to B suggests a short-lived bounce. Upside potential is limited in this phase. Unless major resistance levels are breached, the overall bias remains bearish. Gray wave C could resume the downward move once wave B ends.
Trading Context
Traders should watch for signs of wave B completion, such as loss of momentum or price reversal near resistance. This corrective wave is not a trend change but part of a broader structure. Volatility may rise as the market prepares for the next move.
Position Strategy
Stay cautious with positions, as this is a counter-trend setup. Patterns will help confirm if and when wave C begins. The analysis frames this bounce as temporary, with further downside possible after it ends.
Coal India – Elliott Wave Analysis (Trading Lounge Weekly Chart)
Coal India Weekly Technical Analysis
FUNCTION: Counter Trend
MODE: Corrective
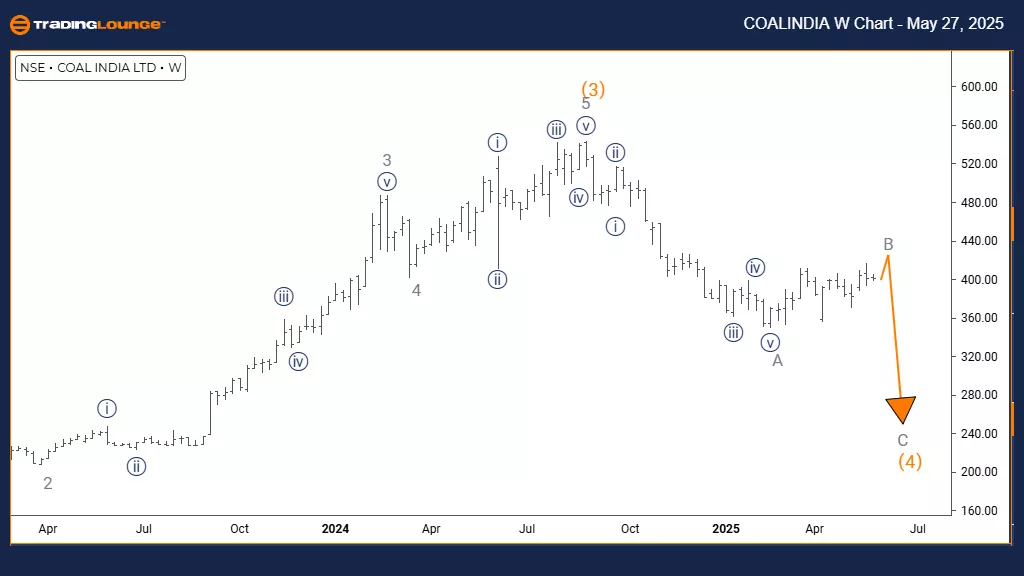
STRUCTURE: Gray Wave B
POSITION: Orange Wave 4
DIRECTION NEXT LOWER DEGREES: Gray Wave C
DETAILS: Gray wave A appears complete; gray wave B is active.
Weekly Trend Perspective
The weekly chart shows Coal India in a correction within a broader bearish trend. Gray wave B is currently progressing within orange wave 4, indicating a pause after gray wave A’s decline. This setup is a common structure before a trend continuation.
Wave Development Insights
Wave B might last longer on the weekly timeframe. Despite this, upside potential stays constrained. It’s likely to remain within typical Fibonacci retracement levels of the prior wave A move, and is not a new bullish trend.
Investment Guidance
Traders should observe resistance zones and weakening momentum—both can signal the end of wave B. This phase offers short-term moves, but the long-term outlook still leans bearish, aiming for gray wave C.
Strategy Reminder
Stay vigilant for completion signs of this corrective wave. Patterns like divergences or strong reversal candles at key levels help confirm a return to bearish momentum. This phase is transitional and likely not the end of the downtrend.
Technical Analyst: Malik Awais
More By This Author:
Elliott Wave Technical Analysis: Fortinet Inc. - Tuesday, May 27
Elliott Wave Technical Analysis: U.S. Dollar/Canadian Dollar - Tuesday, May 27
Elliott Wave Technical Analysis: Hang Seng Index - Tuesday, May 27
At TradingLounge™, we provide actionable Elliott Wave analysis across over 200 markets. Access live chat rooms, advanced AI & algorithmic charting tools, and curated trade ...
more

