Coal India - Indian Stocks Elliott Wave Technical Analysis
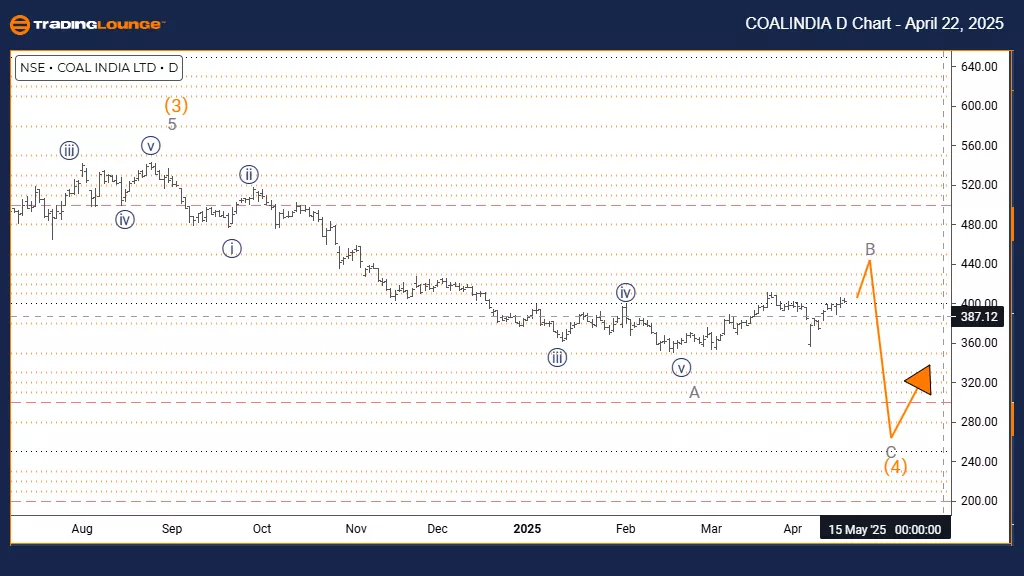
COAL INDIA Elliott Wave Analysis – Trading Lounge Day Chart
COAL INDIA Elliott Wave Technical Analysis
Function: Counter Trend
Mode: Corrective
Structure: Gray Wave B
Position: Orange Wave 4
Direction Next Lower Degrees: Gray Wave C
Details: Gray wave A appears completed; gray wave B is now in progress
The COAL INDIA daily chart illustrates a counter-trend movement developing through a corrective Elliott Wave pattern. The stock has completed gray wave A and is now forming gray wave B, situated within the broader orange wave 4 formation. This configuration suggests a temporary retracement is underway before the likely continuation of the primary downward trend.
Gray wave B typically retraces a portion of the previous wave A’s decline, forming a weaker and often overlapping price structure. It lacks the strength of an impulsive move, indicating that the current upward action is corrective in nature. Based on this wave positioning, the upward movement is expected to be relatively limited before the next downward phase resumes.
Following the completion of wave B, the next likely development is gray wave C, which is anticipated to resume the dominant trend to the downside. This wave would finalize the overall corrective structure. The daily chart context points to an intermediate corrective stage, setting the groundwork for a potential continuation of the broader trend.
Traders should observe wave B for standard corrective traits such as weaker momentum and overlapping price action. These signals can provide insights into the maturity of the correction. The analysis recommends preparing for opportunities that may arise as the correction concludes and the trend resumes.
This corrective setup presents strategic opportunities for traders to align positions in anticipation of a stronger move in gray wave C. Close monitoring of technical indicators and price behavior will be essential to identify when the market is transitioning out of the correction and into a new impulsive phase.

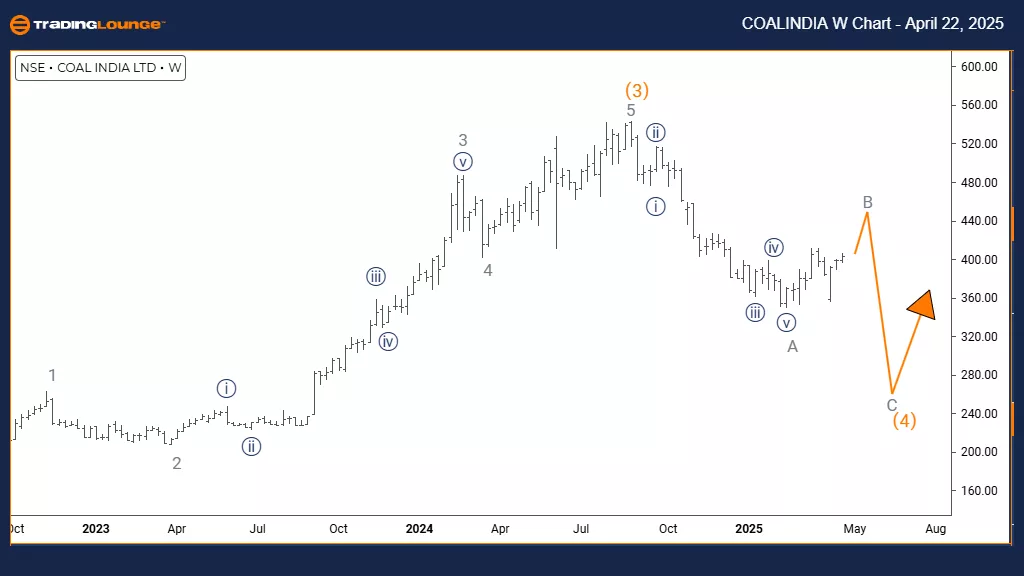
COAL INDIA Elliott Wave Analysis – Trading Lounge Weekly Chart
COAL INDIA Elliott Wave Technical Analysis
Function: Counter Trend
Mode: Corrective
Structure: Gray Wave B
Position: Orange Wave 4
Direction Next Lower Degrees: Gray Wave C
Details: Gray wave A appears completed; wave B is now active
The COAL INDIA weekly chart illustrates a counter-trend correction unfolding within a broader bearish Elliott Wave formation. Following the completion of gray wave A’s decline, the stock is currently developing gray wave B as part of the larger orange wave 4 structure. This phase signals a temporary upward retracement before the likely continuation of the dominant downtrend.
Gray wave B typically represents a corrective rebound, retracing part of wave A’s decline. It commonly spans between 38% to 61% of the prior wave’s move based on Fibonacci levels. As a counter-trend movement, wave B often displays reduced momentum and overlapping price action—hallmarks of corrective behavior. The weekly timeframe confirms this as an intermediate pause within a longer-term bearish trend.
The next expected leg is gray wave C, projected to follow once wave B completes. This move is anticipated to drive prices lower again, concluding the orange wave 4 correction. Traders are advised to monitor wave B for potential exhaustion signals, especially near major Fibonacci retracement zones that may mark reversal points.
This correction offers traders a strategic setup for entering positions aligned with the broader downtrend. The analysis highlights key reversal signs such as bearish price patterns and momentum divergence, which can signal the transition from wave B to wave C. Technical indicators and volume changes will be essential in confirming these signals.
The weekly outlook emphasizes the importance of this correction within the broader market context. Careful analysis of price structure and market signals will help identify optimal trade setups as the market shifts from this corrective phase into the next directional move.

Technical Analyst: Malik Awais
More By This Author:
Elliott Wave Technical Overview: NEO Crypto Price News For Tuesday, April 22
Elliott Wave Technical Analysis: S&P 500 Index - Monday, April 21
Elliott Wave Technical Analysis: British Pound/U.S. Dollar - Monday, April 21
At TradingLounge™, we provide actionable Elliott Wave analysis across over 200 markets. Access live chat rooms, advanced AI & algorithmic charting tools, and curated trade ...
more


