
GBPUSD Elliott Wave Analysis Trading Lounge
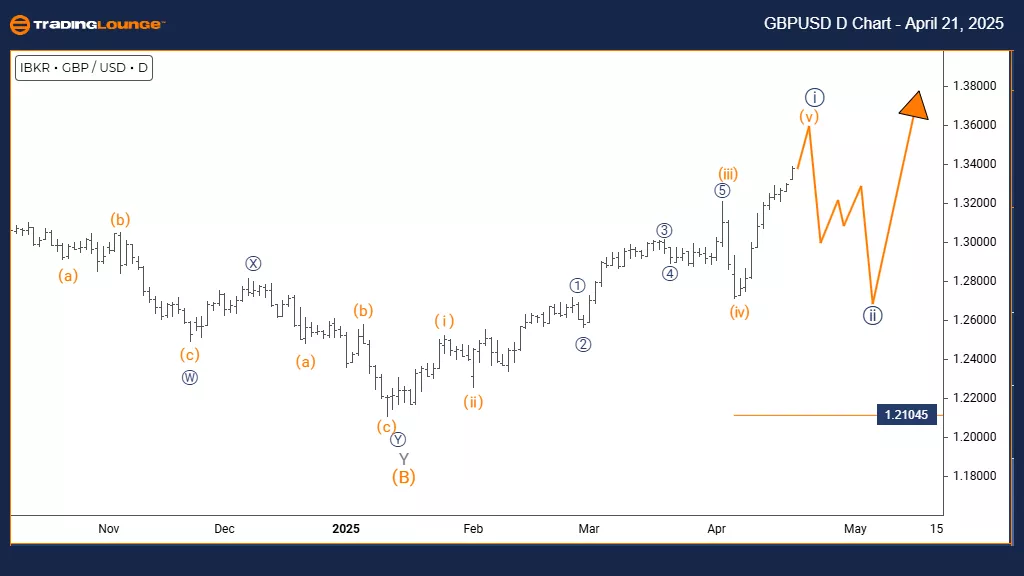
British Pound/U.S. Dollar (GBPUSD) Day Chart
GBPUSD Elliott Wave Technical Analysis
FUNCTION: Trend
MODE: Impulsive
STRUCTURE: Navy Blue Wave 1
POSITION: Gray Wave 1
DIRECTION NEXT LOWER DEGREES: Navy Blue Wave 2
DETAILS: Navy blue wave 1 of gray wave 1 is still active and nearing completion.
Invalidation Level: 1.21045
The GBPUSD daily chart displays a clear trending pattern using the Elliott Wave theory. Currently, the currency pair is moving within navy blue wave 1, part of the broader gray wave 1. This positioning indicates the beginning of a new impulse wave, which could gain momentum in upcoming sessions. The structure suggests this is the first wave in what might develop into a complete five-wave impulse pattern across current and higher timeframes.
Navy blue wave 1 represents the start of a new trend phase. It generally gains strength as the market defines its direction. Though wave 1 usually moves more gradually than later waves, its formation helps confirm a longer-term trend. The ongoing structure indicates wave 1 is nearing completion. Typically, this phase ends after a progressive move before entering a correction.
Next, navy blue wave 2 is expected to follow once wave 1 concludes. This wave should bring a corrective pullback, offering a potential re-entry before the next bullish move—navy blue wave 3. The daily chart gives valuable insights into this unfolding pattern, pointing to a foundational move for a possibly extended trend in the coming period.
The key invalidation level is 1.21045. A drop below this point would void the current Elliott Wave count, and a new analysis would be necessary. This level marks a vital support line that protects the wave's origin point.
Traders should keep an eye on signals that wave 1 is ending. The analysis recommends getting ready for possible trade setups after the wave 2 correction. Typically, wave 3 shows stronger momentum than earlier waves. Technical indicators and price action will help confirm when wave 2 starts and how the structure continues.
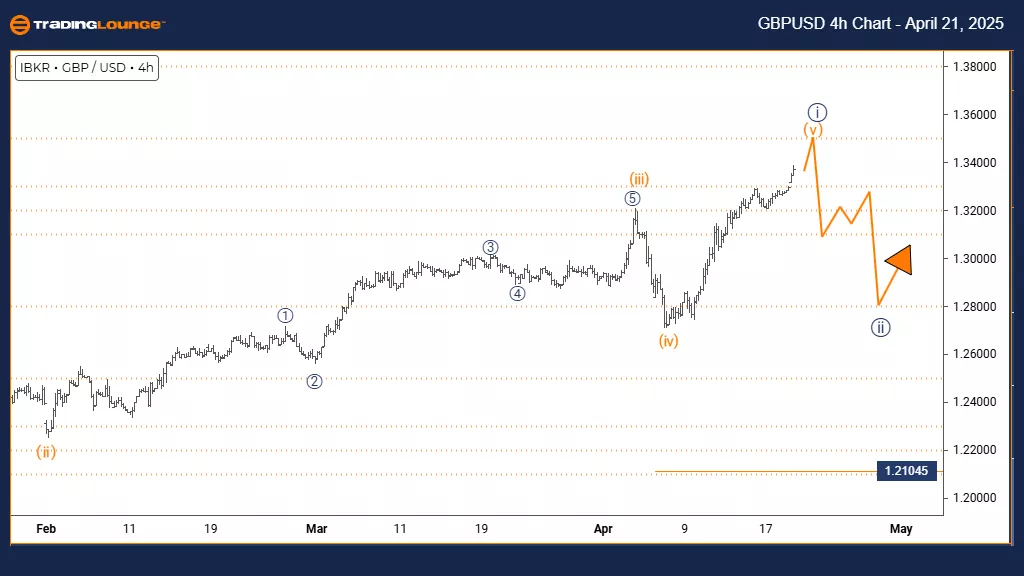
British Pound/U.S. Dollar (GBPUSD) 4 Hour Chart
GBPUSD Elliott Wave Technical Analysis
FUNCTION: Trend
MODE: Impulsive
STRUCTURE: Orange Wave 5
POSITION: Navy Blue Wave 1
DIRECTION NEXT LOWER DEGREES: Navy Blue Wave 2
DETAILS: Orange wave 4 appears to be completed, and orange wave 5 is now underway.
Invalidation Level: 1.21045
The GBPUSD 4-hour chart displays a trending pattern developing within an impulsive Elliott Wave structure. The currency pair has completed the correction of orange wave 4 and has now entered orange wave 5, which is a part of the broader navy blue wave 1. This indicates the final upward movement in the current cycle before a potential broader corrective phase.
Orange wave 5 typically represents the last phase of an impulsive wave. It might show a strong push higher or start to lose strength as it nears the end of the pattern. After wave 4 completed its correction, conditions became favorable for this final move. Often, wave 5 will challenge or exceed previous highs before concluding. Current market behavior suggests that this wave may soon finish, wrapping up the five-wave impulse structure.
Following orange wave 5, navy blue wave 2 is expected to emerge. This wave is likely to be a corrective phase and could offer a short-term pullback before any further upward trend continuation. The invalidation level remains at 1.21045. A move below this price would nullify the current Elliott Wave count, requiring an updated analysis.
Traders should observe common wave 5 termination signs like bearish divergence or reversal formations. The 4-hour timeframe provides valuable insight, suggesting that the uptrend may be losing momentum. It's essential to be prepared for a trend pause, keeping in mind that wave 5 sometimes extends beyond typical limits.
Technical signals and price action will play a key role in confirming when upward momentum fades and wave 2 begins. This analysis encourages monitoring for trend exhaustion signs, while staying alert to the invalidation level. A transition to wave 2 would temporarily interrupt the uptrend before any continuation.
Technical Analyst: Malik Awais
More By This Author:
Elliott Wave Technical Analysis: AAVE Crypto Price News For Friday, April 18
Elliott Wave Technical Forecast: Block, Inc. - Thursday, April 17
Elliott Wave Technical Analysis: NextEra Energy Inc. - Thursday, April 17


Comments
Log in or sign up to join the conversation.