
Elliott Wave Technical Analysis: S&P 500 Index - Monday, April 21
S&P 500 Elliott Wave Analysis Trading Lounge Day Chart
S&P 500 Elliott Wave Technical Analysis
FUNCTION: Trend
MODE: Impulsive
STRUCTURE: Navy Blue Wave 1
POSITION: Gray Wave 3
DIRECTION NEXT LOWER DEGREES: Navy Blue Wave 2
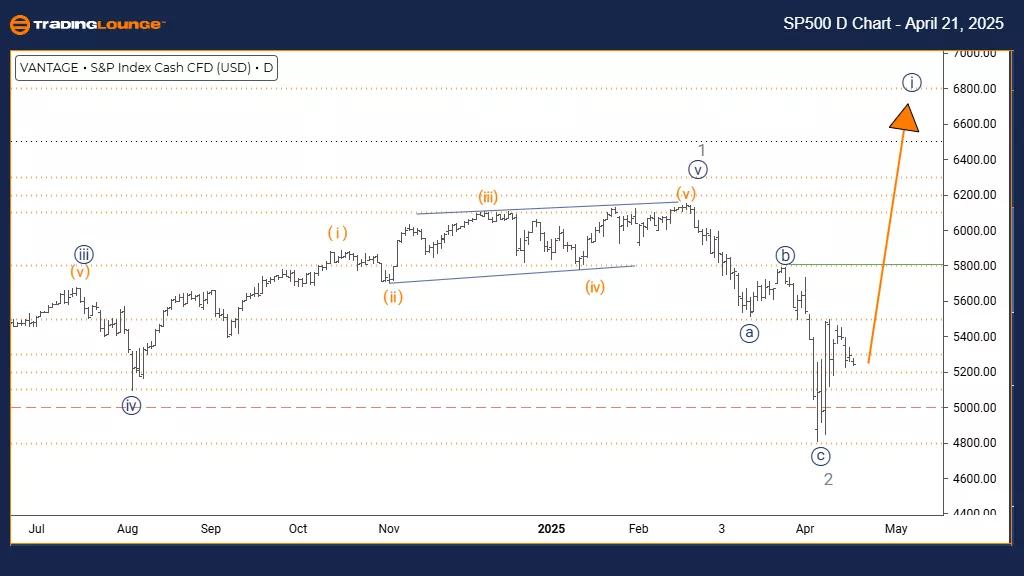
DETAILS: Gray wave 2 appears completed, and navy blue wave 1 of 3 is now active.
The S&P 500 daily chart shows a trending market forming within an impulsive Elliott Wave structure. After completing the correction of gray wave 2, the index has entered navy blue wave 1, which falls under the broader gray wave 3 structure. This placement suggests the early phase of a new impulse wave that may carry strong momentum in the near future.
Navy blue wave 1 marks the beginning of this fresh upward trend. It is typically identified by a gradual gain in momentum as market participants begin aligning with a directional bias. The end of gray wave 2 laid the groundwork for this phase. As is common, wave 1 tends to move with steady but modest strength, establishing the base for the larger trend. Current price behavior suggests a progressive move upwards before the next corrective leg.
Being in gray wave 3 indicates potential for higher momentum moves down the line, making this early stage important for traders looking to enter long positions. The daily timeframe offers a detailed view of this evolving wave pattern, highlighting the opportunity for building bullish momentum from current levels.
Traders should observe wave 1 characteristics such as consistent price increases and gradually rising volume. The outlook supports looking for setups aligned with the ongoing trend. While wave 1 may not show sharp moves, it is crucial for setting up the structure of the broader pattern. Monitoring technical indicators and price signals will help validate the wave’s progress.
The next phase to expect is navy blue wave 2, which should follow once wave 1 ends. This wave is anticipated to act as a correction, potentially offering a pullback before wave 3 initiates a stronger upward push. Observing price and momentum indicators will be essential for identifying this transition.
S&P 500 Elliott Wave Analysis Trading Lounge Weekly Chart
S&P 500 Elliott Wave Technical Analysis
FUNCTION: Trend
MODE: Impulsive
STRUCTURE: Navy Blue Wave 1
POSITION: Gray Wave 3
DIRECTION NEXT LOWER DEGREES: Navy Blue Wave 2
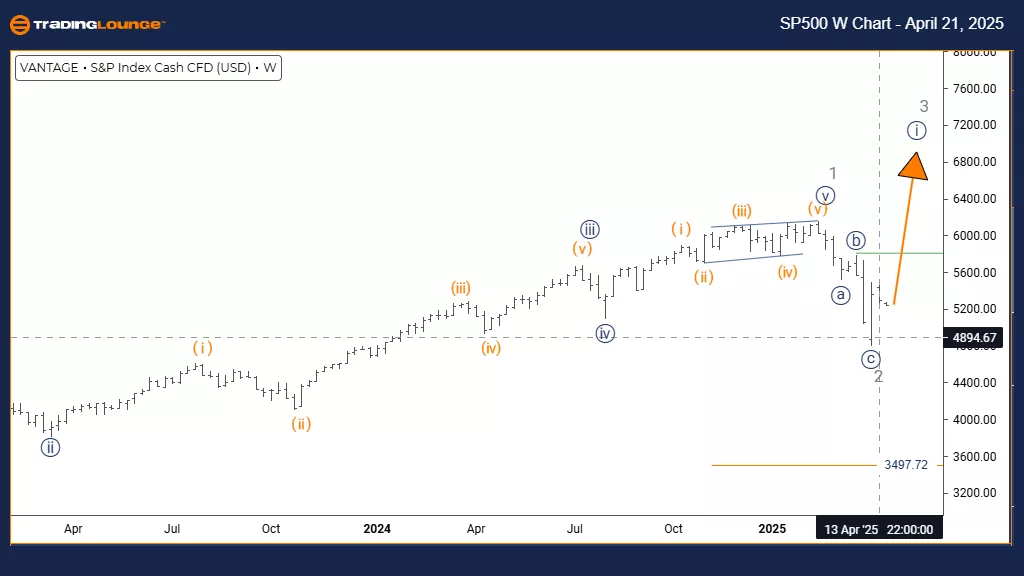
DETAILS: Gray wave 2 appears completed, with navy blue wave 1 of 3 now active.
The S&P 500 weekly chart indicates a strong trending pattern developing under the Elliott Wave framework. After completing the gray wave 2 correction, the index has entered navy blue wave 1, which forms part of the broader gray wave 3 structure. This setup points to the start of a new impulse wave with the potential for notable upside in the weeks ahead.
Navy blue wave 1 is the first phase of this developing bullish trend. Typically, wave 1 brings gradual price increases as the market starts aligning with a directional move. The conclusion of gray wave 2 paved the way for this early impulse. Wave 1 generally builds momentum progressively before stronger movements appear in the following waves. The weekly chart timeframe suggests the potential beginning of a medium-term upward trend.
This structure supports the transition into a significant gray wave 3 at a higher degree, where navy blue wave 1 acts as the first leg. Historically, wave 3 tends to be the most powerful phase in an Elliott Wave cycle, so this formation holds importance for medium- to long-term trend strategies. Traders should look for wave 1 behavior like improving technical conditions and rising volume.
Once navy blue wave 1 completes, a corrective navy blue wave 2 is expected. This phase should offer a temporary pullback before the index resumes its climb in wave 3. The weekly perspective highlights the importance of this unfolding structure, urging traders to confirm wave development using price action and supporting technical tools. The analysis suggests this could be a favorable setup for trend-following strategies in the coming period.
Technical Analyst: Malik Awais
More By This Author:
Elliott Wave Technical Analysis: AAVE Crypto Price News For Friday, April 18
Elliott Wave Technical Forecast: Block, Inc. - Thursday, April 17
Elliott Wave Technical Analysis: NextEra Energy Inc. - Thursday, April 17
At TradingLounge™, we provide actionable Elliott Wave analysis across over 200 markets. Access live chat rooms, advanced AI & algorithmic charting tools, and curated trade ...
more

