
Update to this post. Official Chinese statistics indicate 6.3% y/y growth in Q2. Maybe it’s less?
The FRBSF China Cyclical Activity Tracker (China CAT) of Fernald, Hsu and Spiegel (JIMF, 2020) indicates slower growth than reported by NBS:
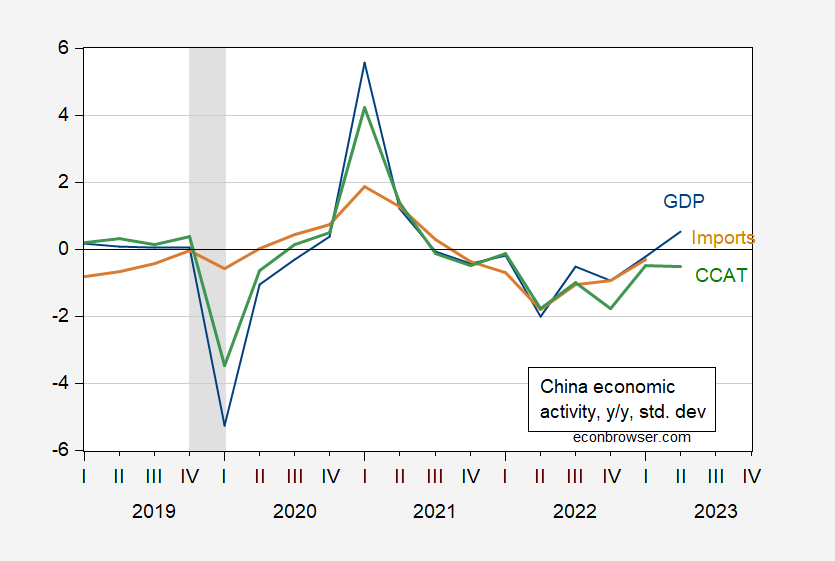
Figure 1: Official Chinese GDP growth, standardized and detrended (blue), CCAT (green), and Imports (tan), in standard deviation units. ECRI defined peak-to-trough recession dates shaded gray. Source: China CAT (August 2023 version), ECRI.
Note that the Q2 observation for CCAT is different from usual because the consumption series was available only through April. Why the release of consumption data was delayed is a mystery (although periodic delays are not altogether unexpected).
The authors conclude:
Over the past four quarters ending in the second quarter of 2023, growth in cyclical Chinese economic activity was -0.51 standard deviations from trend.
In the previous version of this post, I translated the CCAT reading in standard deviation units into GDP growth using an ad hoc regression, resulting in an implied 5.3% growth rate. The authors of the SF Fed China CAT (John Fernald, Mark Spiegel and their team) were kind enough to provide me with the methodologically consistent translation of their China CAT readings to GDP. These results are reported in Figure 2.
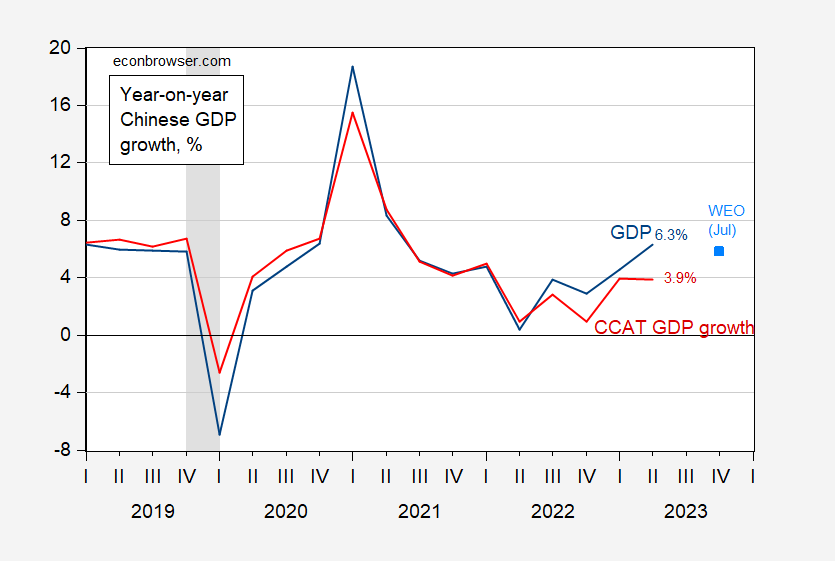
Figure 2: Year-on-Year Chinese GDP growth (blue), and growth implied by China CAT (red), IMF WEO July forecast (sky blue square). ECRI defined peak-to-trough recession dates shaded gray. Source: NBS, personal communication, IMF WEO July update, ECRI and author’s calculations.
The GDP growth rate implied with Q2 CCAT is 3.9% instead of 6.3%. The intuition for the translation is as follows:
Our estimated GDP trend is about 5.1% (final tab in the CCATspreadsheet), which is based on a biweight filter with a bandwidth of 24 quarters. (The estimated trend was about 6 percent back in 2019). The standard deviation of detrended GDP is about 2.4 percent for the full sample. So if growth is 0.51 standard deviations below trend, then it would correspond to growth of around 3.9%.
This low numbers merely add to concerns heightened by the release of July trade figures, as well as deflation in the CPI y/y.
More By This Author:
Better To Light One Candle Than Curse The Darkness*: Real Wage Edition
Inflation In July: Central Tendency Down
Chinese Inflation In July


Comments
Log in or sign up to join the conversation.