
CAC 40 (France) Index Elliott Wave Technical Forecast
CAC 40 (France) Elliott Wave Analysis Trading Lounge Day Chart
CAC 40 (France) Wave Technical Analysis
FUNCTION: Bullish Trend
MODE: Impulsive
STRUCTURE: Navy Blue Wave 1
POSITION: Gray Wave 3
DIRECTION NEXT LOWER DEGREES: Navy Blue Wave 2
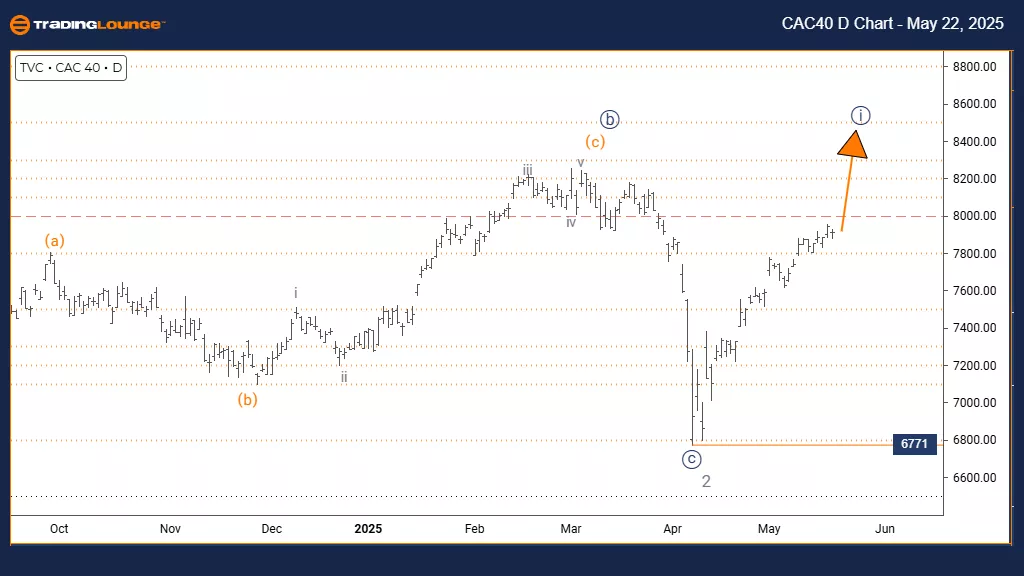
DETAILS: Gray wave 2 seems completed. Navy blue wave 1 of 3 is now progressing. Invalidation level: 6771
The daily chart analysis indicates strong bullish momentum in the CAC 40 index within an established uptrend. The structure shows navy blue wave 1 forming within gray wave 3, suggesting gray wave 2's correction is complete. The index has entered an initial impulse wave, typically a strong upward movement within Elliott Wave theory.
The transition into navy blue wave 1 is confirmed, highlighting growing bullish momentum. The impulse pattern suggests strong buying interest, and this phase might expand further. The invalidation level at 6771 remains vital for evaluating trend validity, as a breach could indicate a more complex correction or trend reversal.
This technical view gives investors key insights into the index's phase within its larger cycle. The CAC 40 may continue rising during this segment, with gains likely until the next corrective move — expected as navy blue wave 2. Investors should track bullish continuation signs and prepare for possible corrections following wave one's completion.
The analysis guides risk management strategies during this new bullish phase. While the setup favors upward movement, traders should apply risk controls due to the wave's early stage. The current bullish trend looks to remain strong, supported by the initial structure of a larger advancing sequence.
CAC 40 (France) Elliott Wave Analysis Trading Lounge Weekly Chart
CAC 40 (France) Wave Technical Analysis
FUNCTION: Bullish Trend
MODE: Impulsive
STRUCTURE: Gray Wave 3
POSITION: Orange Wave 1
DIRECTION NEXT HIGHER DEGREES: Gray Wave 3 (Started)
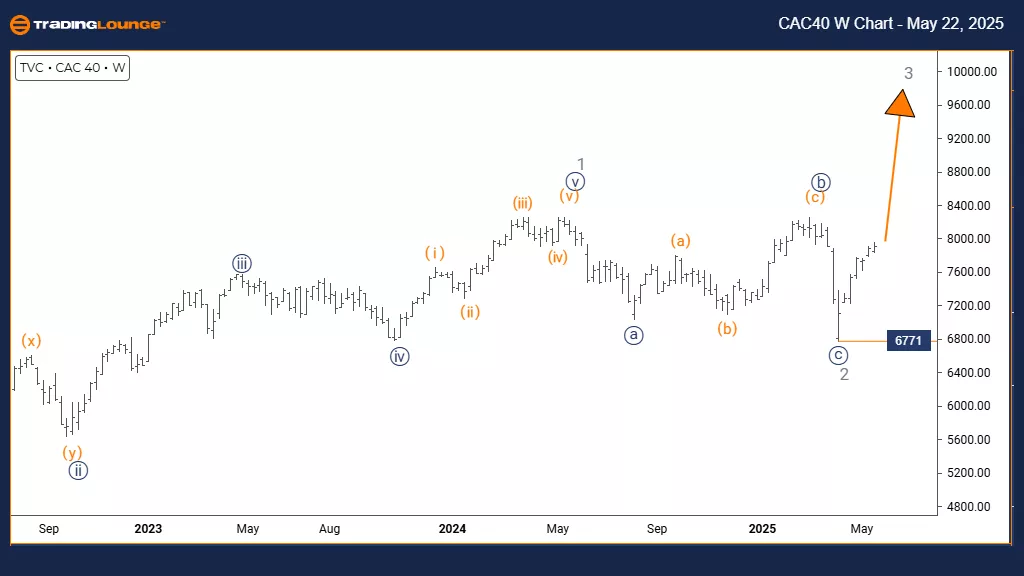
DETAILS: Gray wave 2 seems completed. Gray wave 3 is now active. Invalidation level: 6771
The weekly chart reveals a highly bullish setup for the CAC 40 index, supported by a clearly impulsive wave structure. The chart identifies gray wave 3 within a broader bullish phase. This means the prior correction (gray wave 2) has ended and a strong impulse movement has begun, potentially offering substantial upward momentum.
The chart confirms the start of gray wave 3. The market's behavior suggests strong institutional buying, and this phase may continue for a considerable time. This wave structure represents a vital segment of the broader bullish cycle, often providing large moves during its development.
This analysis offers critical insights for investors on where the index stands within its long-term uptrend. The CAC 40 seems positioned for significant growth during this wave phase, but like all impulse patterns, a correction is expected eventually. The wave 3 segment tends to deliver the most extended movement in Elliott structures.
Traders should track bullish continuation patterns, while maintaining sound risk management during this prolonged upward move. The 6771 level remains a reference point; if breached, it could change the current outlook. The weekly view supports the potential for sustained gains but also cautions vigilance for signs of wave exhaustion.
Technical Analyst: Malik Awais
More By This Author:
Elliott Wave Technical Analysis: Theta Token Crypto Price News For Thursday, May 22
Elliott Wave Technical Analysis & Trading Strategies: S&P 500, Nasdaq 100, DAX 40, FTSE 100, ASX 200
Elliott Wave Technical Forecast: Newmont Corporation - Wednesday, May 21
At TradingLounge™, we provide actionable Elliott Wave analysis across over 200 markets. Access live chat rooms, advanced AI & algorithmic charting tools, and curated trade ...
more

