

Image Source: Unsplash
- AUD/JPY hits a 17-year peak at 106.37, following the BoJ's decision to maintain interest rates.
- Technicals indicate a strong uptrend with RSI in bullish territory; upcoming resistance at 106.50 and 107.00.
- Support levels include Tenkan-Sen at 104.98, Senkou Span A at 104.73, and Kijun-Sen at 104.49.
The Australian Dollar surged to a new 17-year high of 106.37 against the Japanese Yen as the Bank of Japan failed to increase interest rates on its latest monetary policy decision, which weighed on the Japanese currency. Therefore, the AUD/JPY rallied higher and traded at 106.22, up 0.16%.
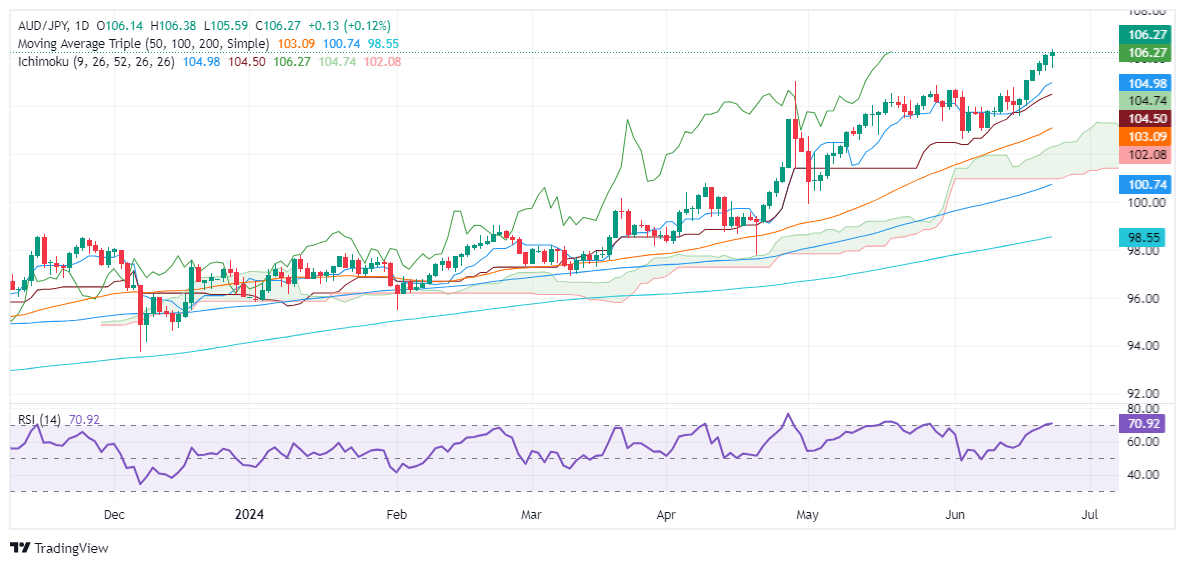
AUD/JPY Price Analysis: Technical outlook
The AUD/JPY cross-pair uptrend remains intact, with the pair breaching the previous year-to-date (YTD) high of 104.94, which opened the door to test 105.00 and beyond. Even though momentum favors buyers with the Relative Strength Index (RSI) in bullish territory, downside risks remain due to verbal intervention by Japanese authorities.
If the JPY continued to depreciate steadily, that could pave the way for further gains. The next resistance would be the 106.50, ahead of 107.00. UP next would be the October 2007 peak at 107.86.
Conversely, if the cross-pair extends its losses past 106.00, the first support would be the Tenkan-Sen at 104.98, followed by the Senkou Span A at 104.73. Once cleared, the bull’s last line of defense would be the Kijun-Sen at 104.49.
AUD/JPY Price Action – Daily Chart
AUD/JPY
| OVERVIEW | |
|---|---|
| Today last price | 106.26 |
| Today Daily Change | 0.12 |
| Today Daily Change % | 0.11 |
| Today daily open | 106.14 |
| TRENDS | |
|---|---|
| Daily SMA20 | 104.35 |
| Daily SMA50 | 102.95 |
| Daily SMA100 | 100.64 |
| Daily SMA200 | 98.49 |
| LEVELS | |
|---|---|
| Previous Daily High | 106.16 |
| Previous Daily Low | 105.47 |
| Previous Weekly High | 106.16 |
| Previous Weekly Low | 103.59 |
| Previous Monthly High | 104.87 |
| Previous Monthly Low | 99.93 |
| Daily Fibonacci 38.2% | 105.9 |
| Daily Fibonacci 61.8% | 105.73 |
| Daily Pivot Point S1 | 105.69 |
| Daily Pivot Point S2 | 105.23 |
| Daily Pivot Point S3 | 105 |
| Daily Pivot Point R1 | 106.38 |
| Daily Pivot Point R2 | 106.62 |
| Daily Pivot Point R3 | 107.07 |
More By This Author:
Gold Price Drops On Firm US Yields, Strong USD After Solid US Data
Silver Price Analysis: XAG/USD Sunk Below $30.00 As Bearish-Engulfing Pattern Loomed
USD/JPY Price Analysis: Surges Past 159.00, Approaches Yentervention Levels


Comments
Log in or sign up to join the conversation.