

Image Source: Pixabay
- USD/JPY rises to 159.59, nearing the pivotal 160.00 mark, propelled by robust US PMI data.
- Key resistance at 160.00 and YTD high of 160.32; potential for Bank of Japan intervention looms.
- Support found at 159.00, June 14 high of 158.25, 158.00, with additional support at Tenkan-Sen (157.69) and Senkou Span A (157.40).
The US Dollar climbs against the Japanese Yen on Friday and approaches intervention levels ahead of the weekend. Stronger than expected US S&P Global Flash PMIs overshadowed weaker housing data and weighed the JPY. Therefore, the USD/JPY trades at 159.59, gains 0.42%.
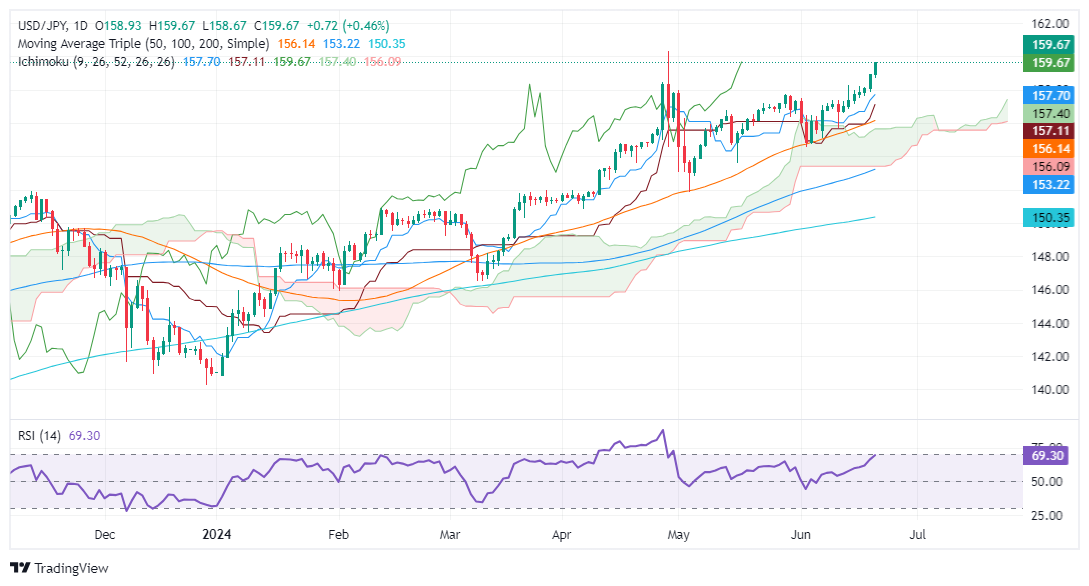
USD/JPY Price Analysis: Technical outlook
The major has finally broken the barrier of 159.00 and closes to intervention levels reached on April 29, when the USD/JPY cleared the 160.00 figure. This triggered a reaction by the Bank of Japan, which intervened in the FX space, sending the pair tumbling 400 pips to 156.06 after hitting a daily high of 160.32.
Despite that, the USD/JPY remains upward biased, and the next resistance would be 160.00. Once cleared up, next would be the year-to-date (YTD) high of 160.32.
Conversely, the most likely scenario due to intervention threats is the USD/JPY first support of 159.00. Once cleared, the next support would be the June 14 high at 158.25, followed by 158.00. Further losses are seen at the Tenkan-Sen at 157.69, followed by Senkou Span A at 157.40, ahead of the Kijun-Sen at 157.11
USD/JPY Price Action – Daily Chart
USD/JPY
| OVERVIEW | |
|---|---|
| Today last price | 159.66 |
| Today Daily Change | 0.72 |
| Today Daily Change % | 0.45 |
| Today daily open | 158.94 |
| TRENDS | |
|---|---|
| Daily SMA20 | 157.01 |
| Daily SMA50 | 156.01 |
| Daily SMA100 | 153.1 |
| Daily SMA200 | 150.29 |
| LEVELS | |
|---|---|
| Previous Daily High | 158.95 |
| Previous Daily Low | 157.84 |
| Previous Weekly High | 158.26 |
| Previous Weekly Low | 155.72 |
| Previous Monthly High | 157.99 |
| Previous Monthly Low | 151.86 |
| Daily Fibonacci 38.2% | 158.52 |
| Daily Fibonacci 61.8% | 158.26 |
| Daily Pivot Point S1 | 158.2 |
| Daily Pivot Point S2 | 157.46 |
| Daily Pivot Point S3 | 157.09 |
| Daily Pivot Point R1 | 159.31 |
| Daily Pivot Point R2 | 159.69 |
| Daily Pivot Point R3 | 160.43 |
More By This Author:
GBP/USD Price Analysis: Extends Losses And Approaches 1.2600Silver Price Analysis: XAG/USD Stays Firm And Consolidates Around $29.50
Gold Price Rallied On Weak US Inflation Despite Hawkish Fed Tilt


Comments
Log in or sign up to join the conversation.