
The Federal Housing Finance Agency (FHFA) has released its U.S. House Price Index (HPI) for October. Here is the opening of the press release:
Washington, D.C. – U.S. house prices rose 12.4 percent from the third quarter of 2021 to the third quarter of 2022 according to the Federal Housing Finance Agency House Price Index (FHFA HPI®). House prices were up 0.1 percent compared to the second quarter of 2022. FHFA’s seasonally adjusted monthly index for September was up 0.1 percent from August.
“House prices were flat for the third quarter but continued to remain above levels from a year ago.” said William Doerner, Ph.D., Supervisory Economist in FHFA’s Division of Research and Statistics. “The rate of U.S. house price growth has substantially decelerated. This deceleration is widespread with about one-third of all states and metropolitan statistical areas registering annual growth below 10 percent.”
The chart below illustrates the monthly HPI series, which is not adjusted for inflation, along with a real (inflation-adjusted) series using the Consumer Price Index: All Items Less Shelter.
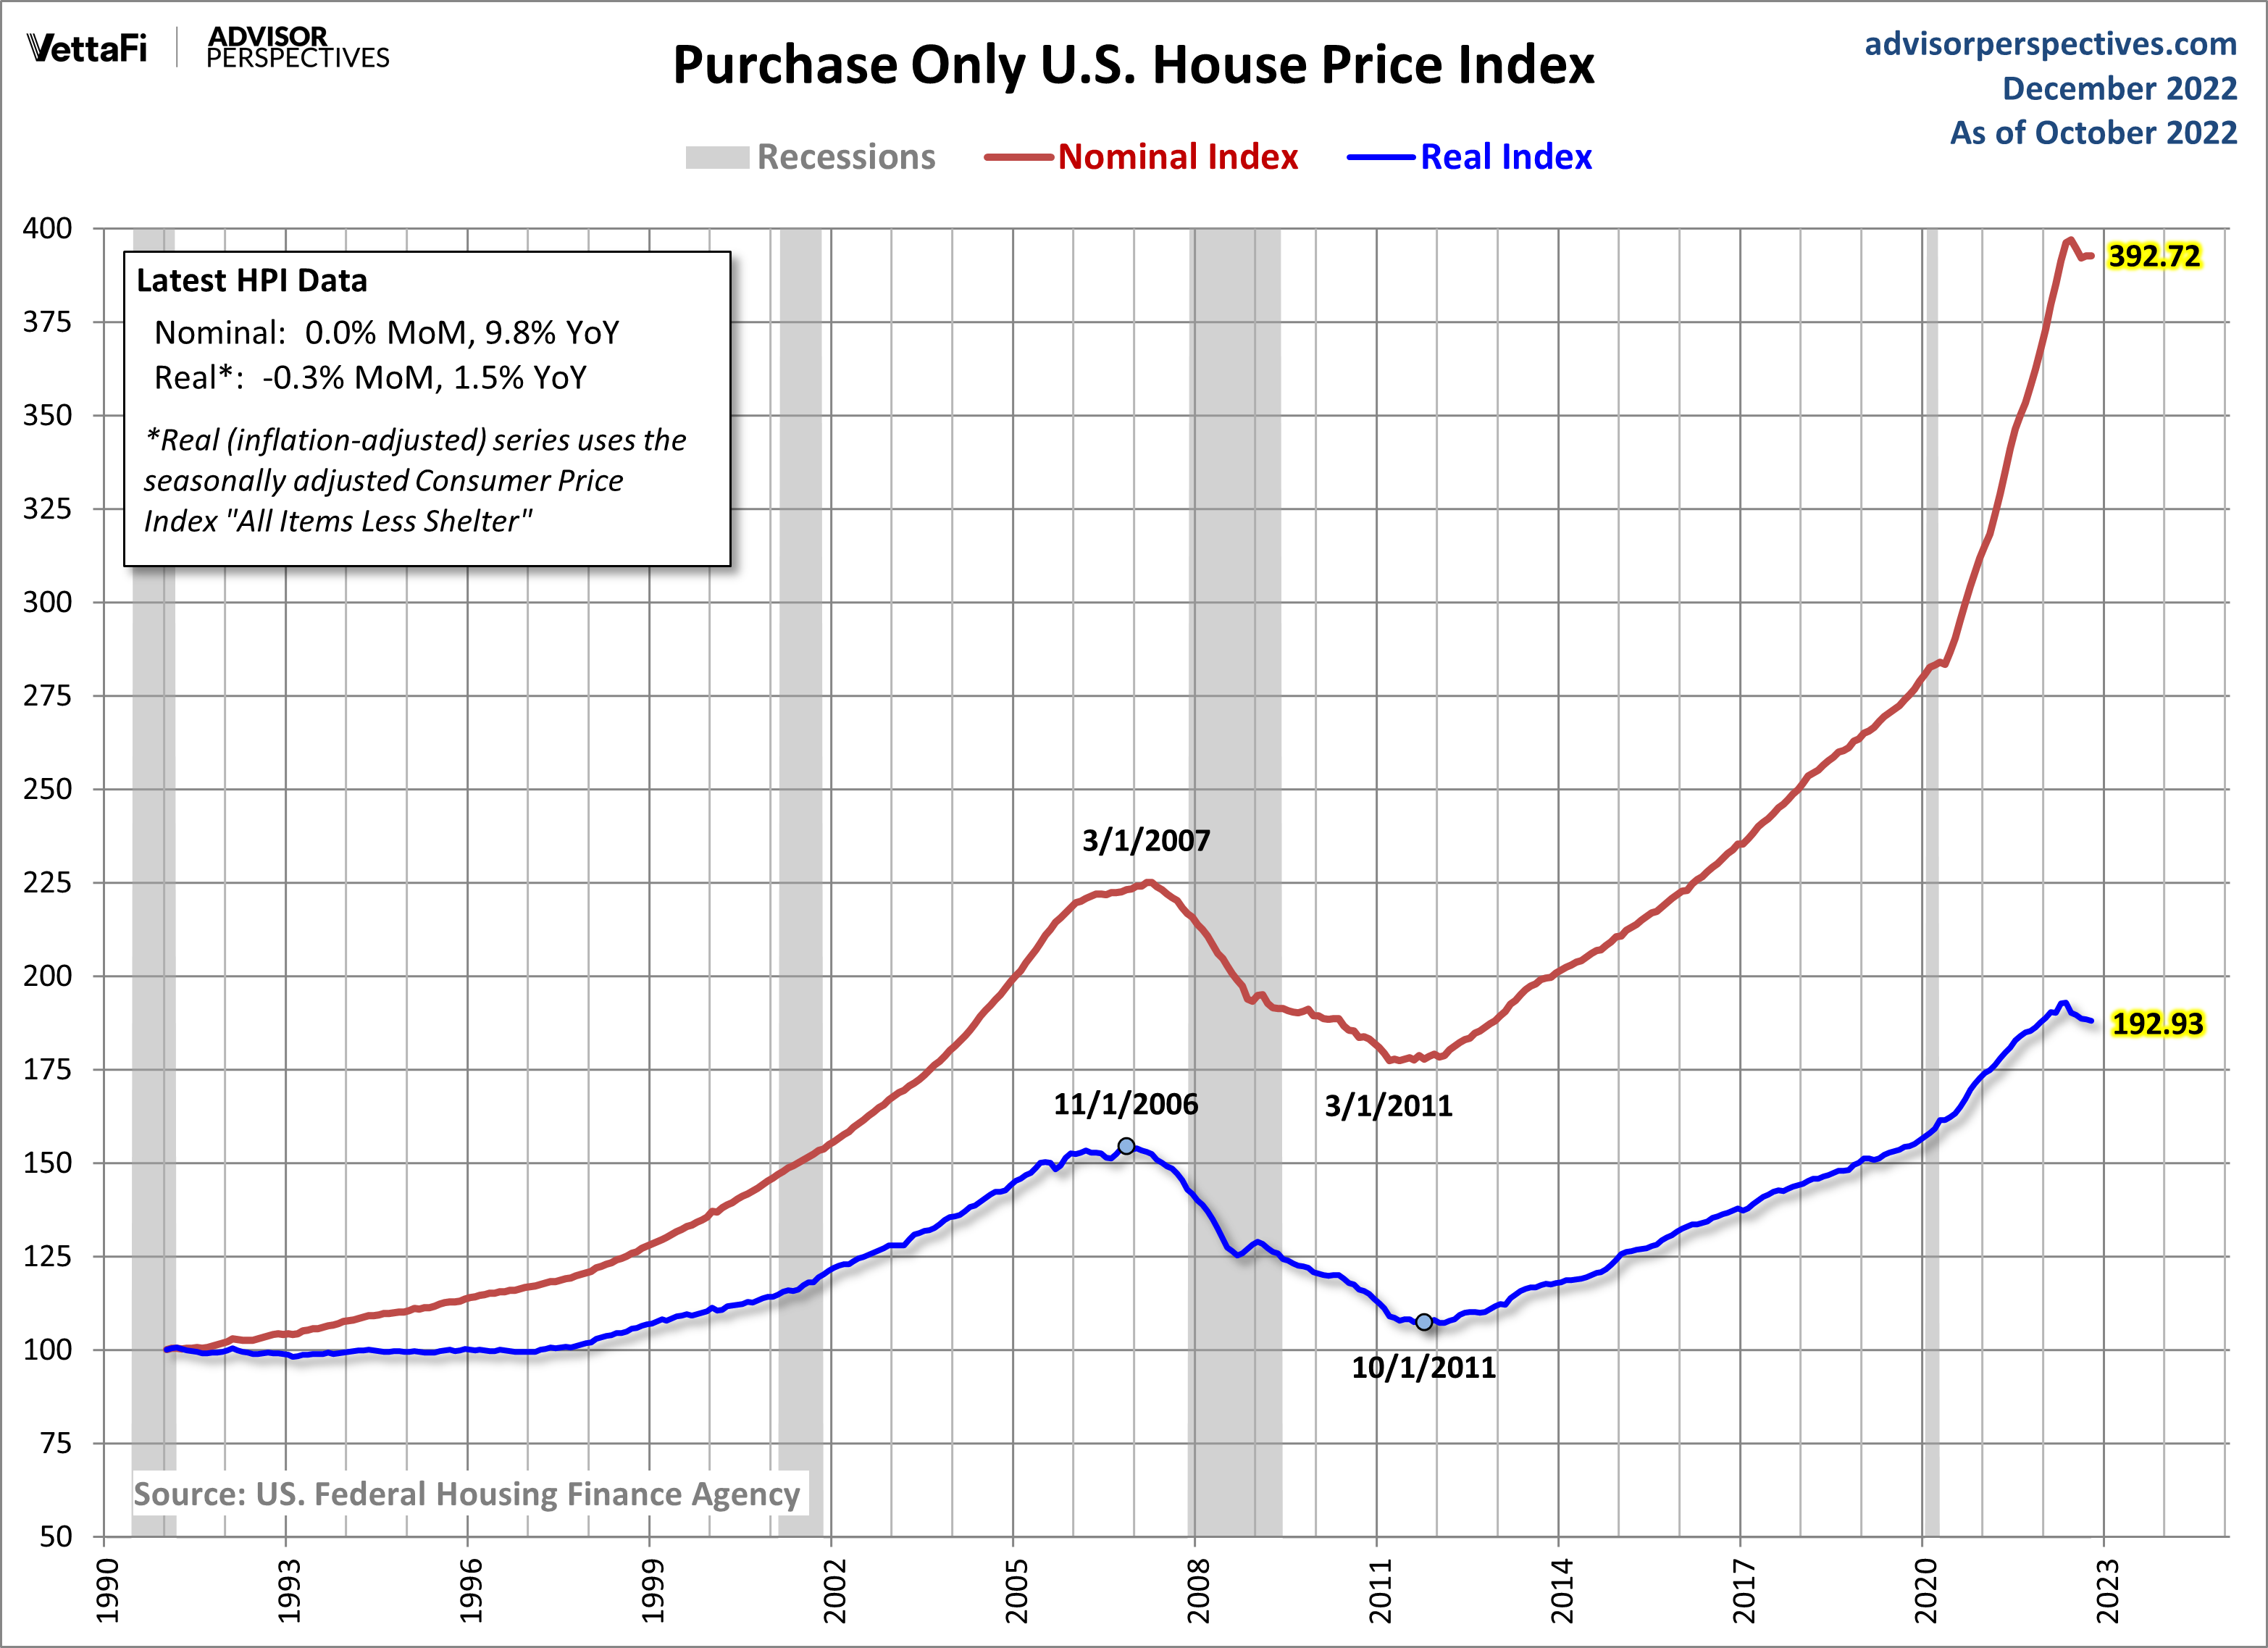
In the chart above we see that the nominal HPI index has exceeded its pre-recession peak of what's generally regarded to have been a housing bubble.
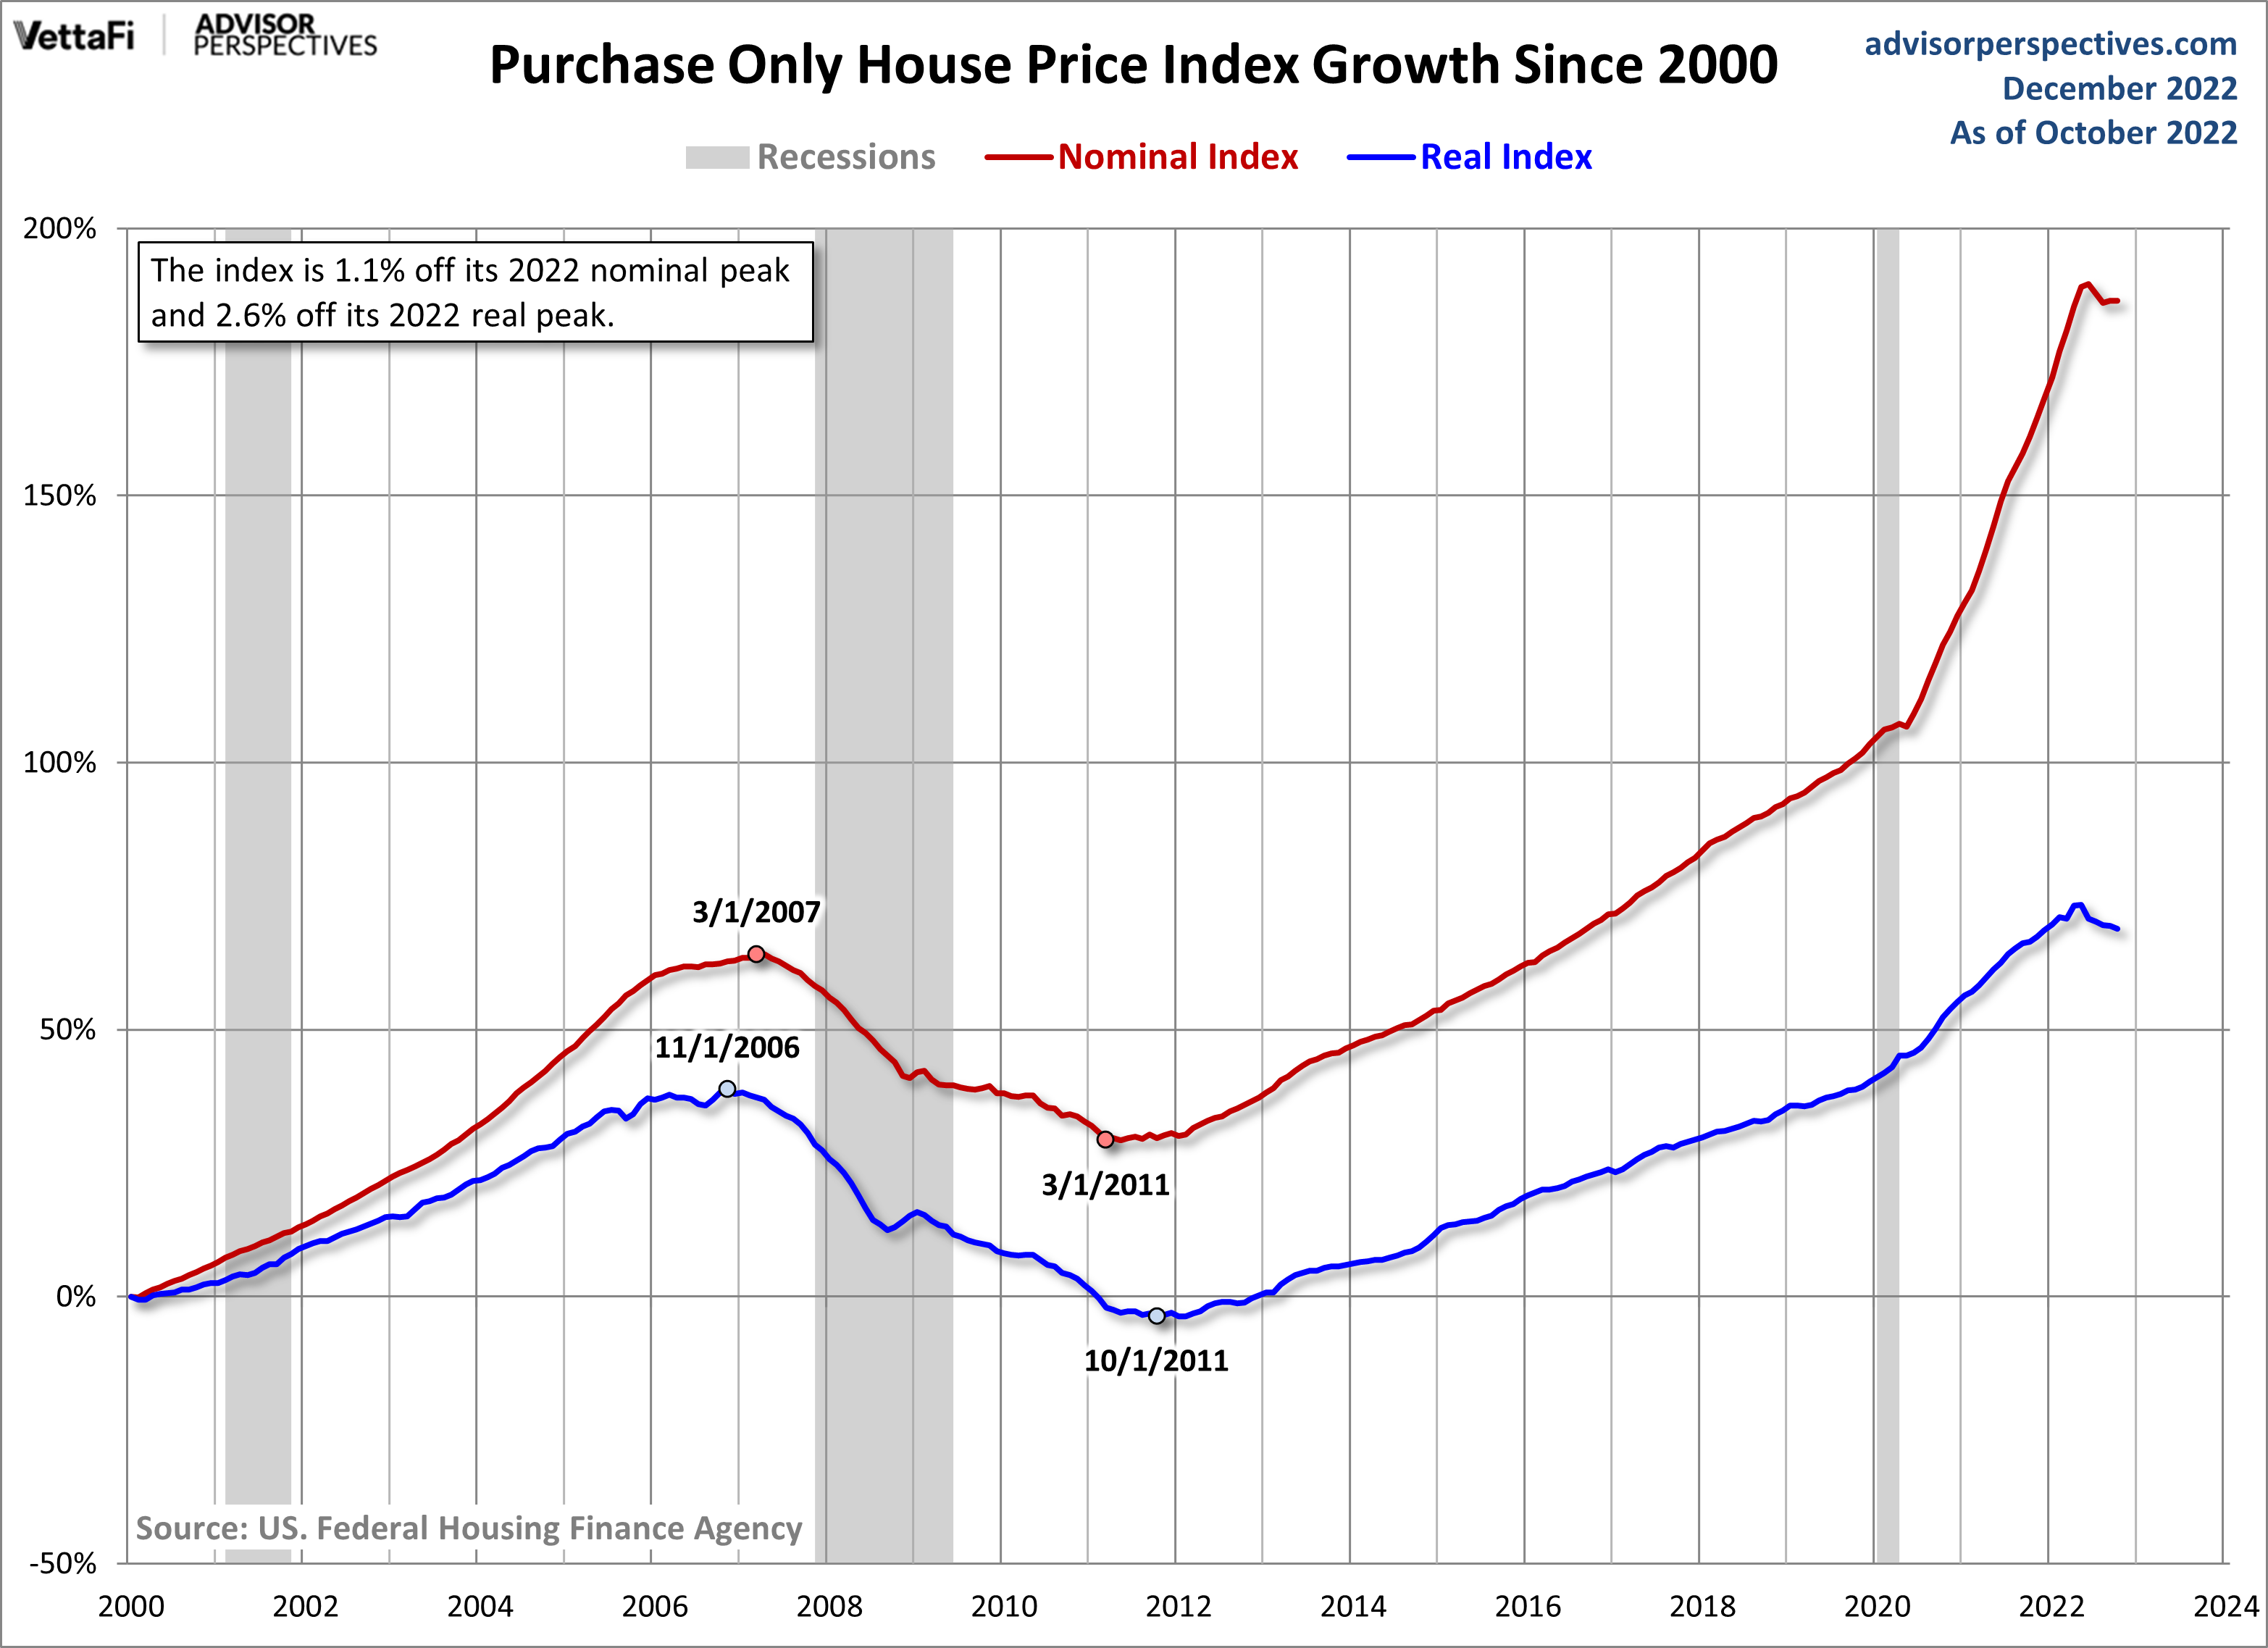
The next chart shows the growth of the nominal and real index since the turn of the century.
For an interesting comparison, let's overlay the HPI and the most closely matching subcomponent of the Consumer Price Index, Owners' Equivalent Rent of Residences (OER). Note: For an explanation of OER, see this PDF commentary from the Bureau of Labor Statistics.
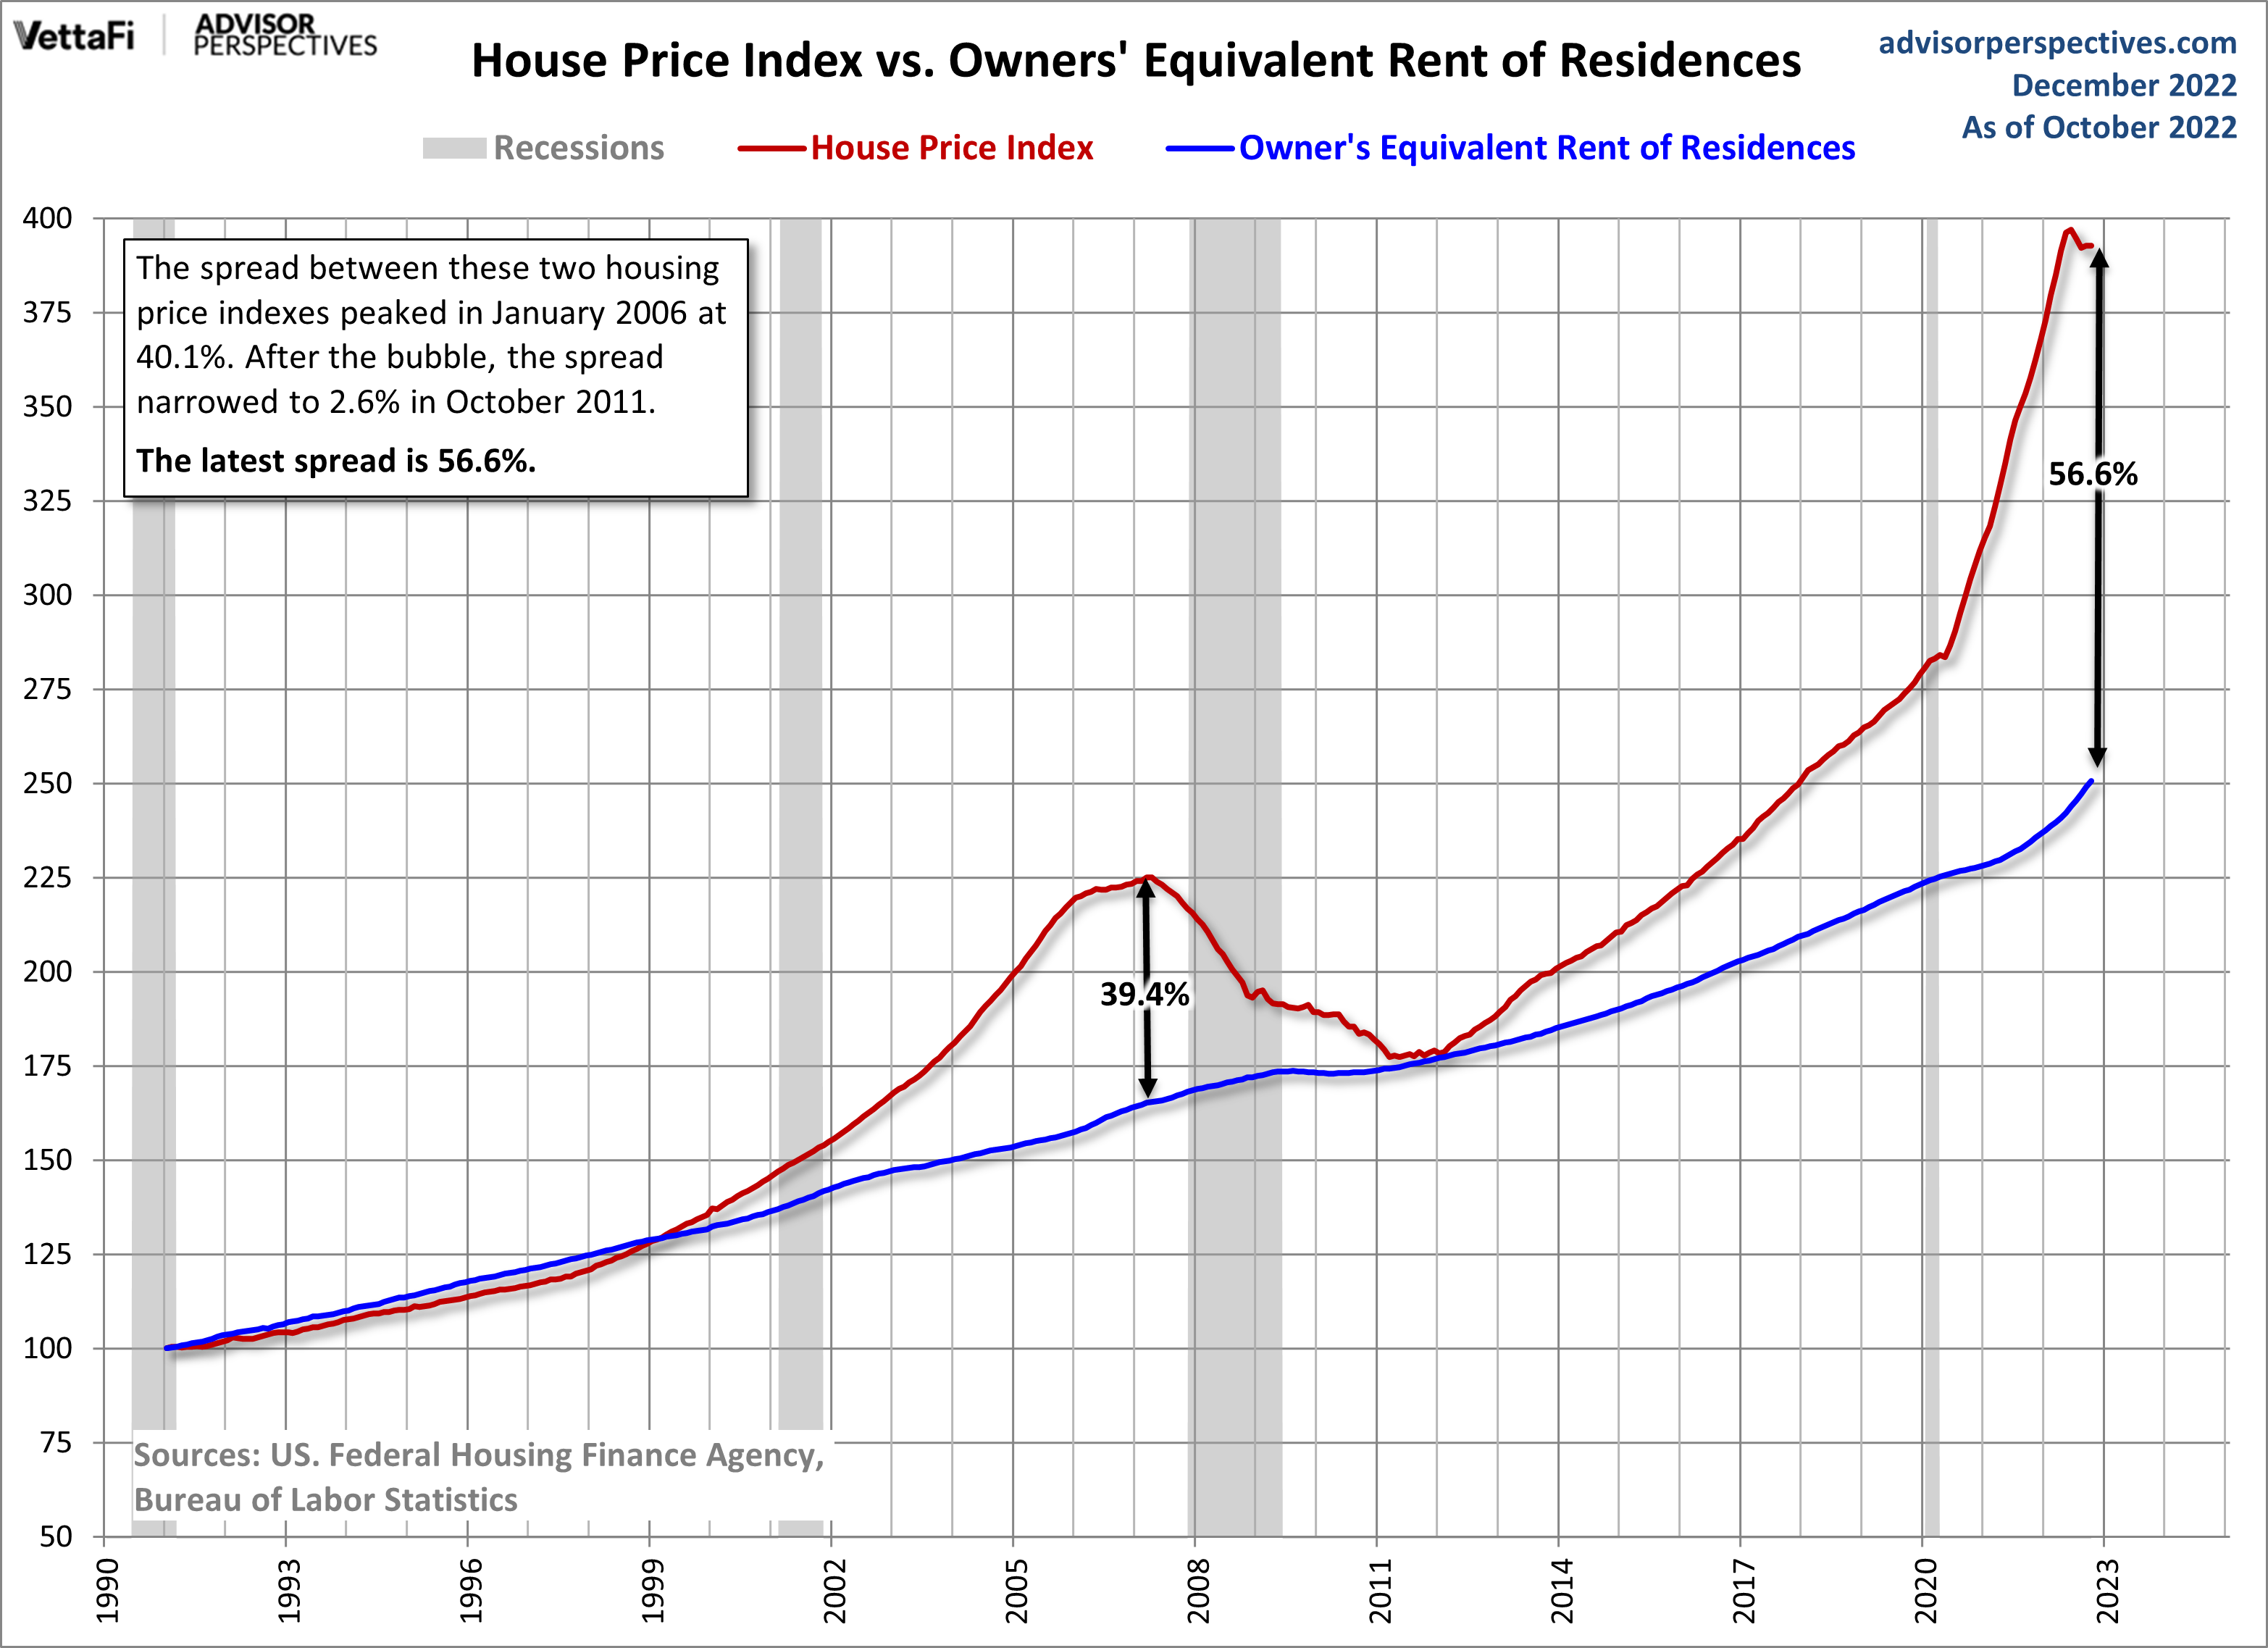
HPI and OER moved in close parallel from the 1991 inception date of the former until early 1999 when the two parted company and HPI began accelerating into the housing bubble. HPI then fell 20.7% over the next 48 months to its March 2007 trough. Confirmation of the "bubble" designation for house prices is the 39.4% spread between HPI and OER in January 2006.
Are we in another housing bubble? The current spread is 56.6%, exceeding the "bubble designation" just mentioned. This is just below its all-time peak.
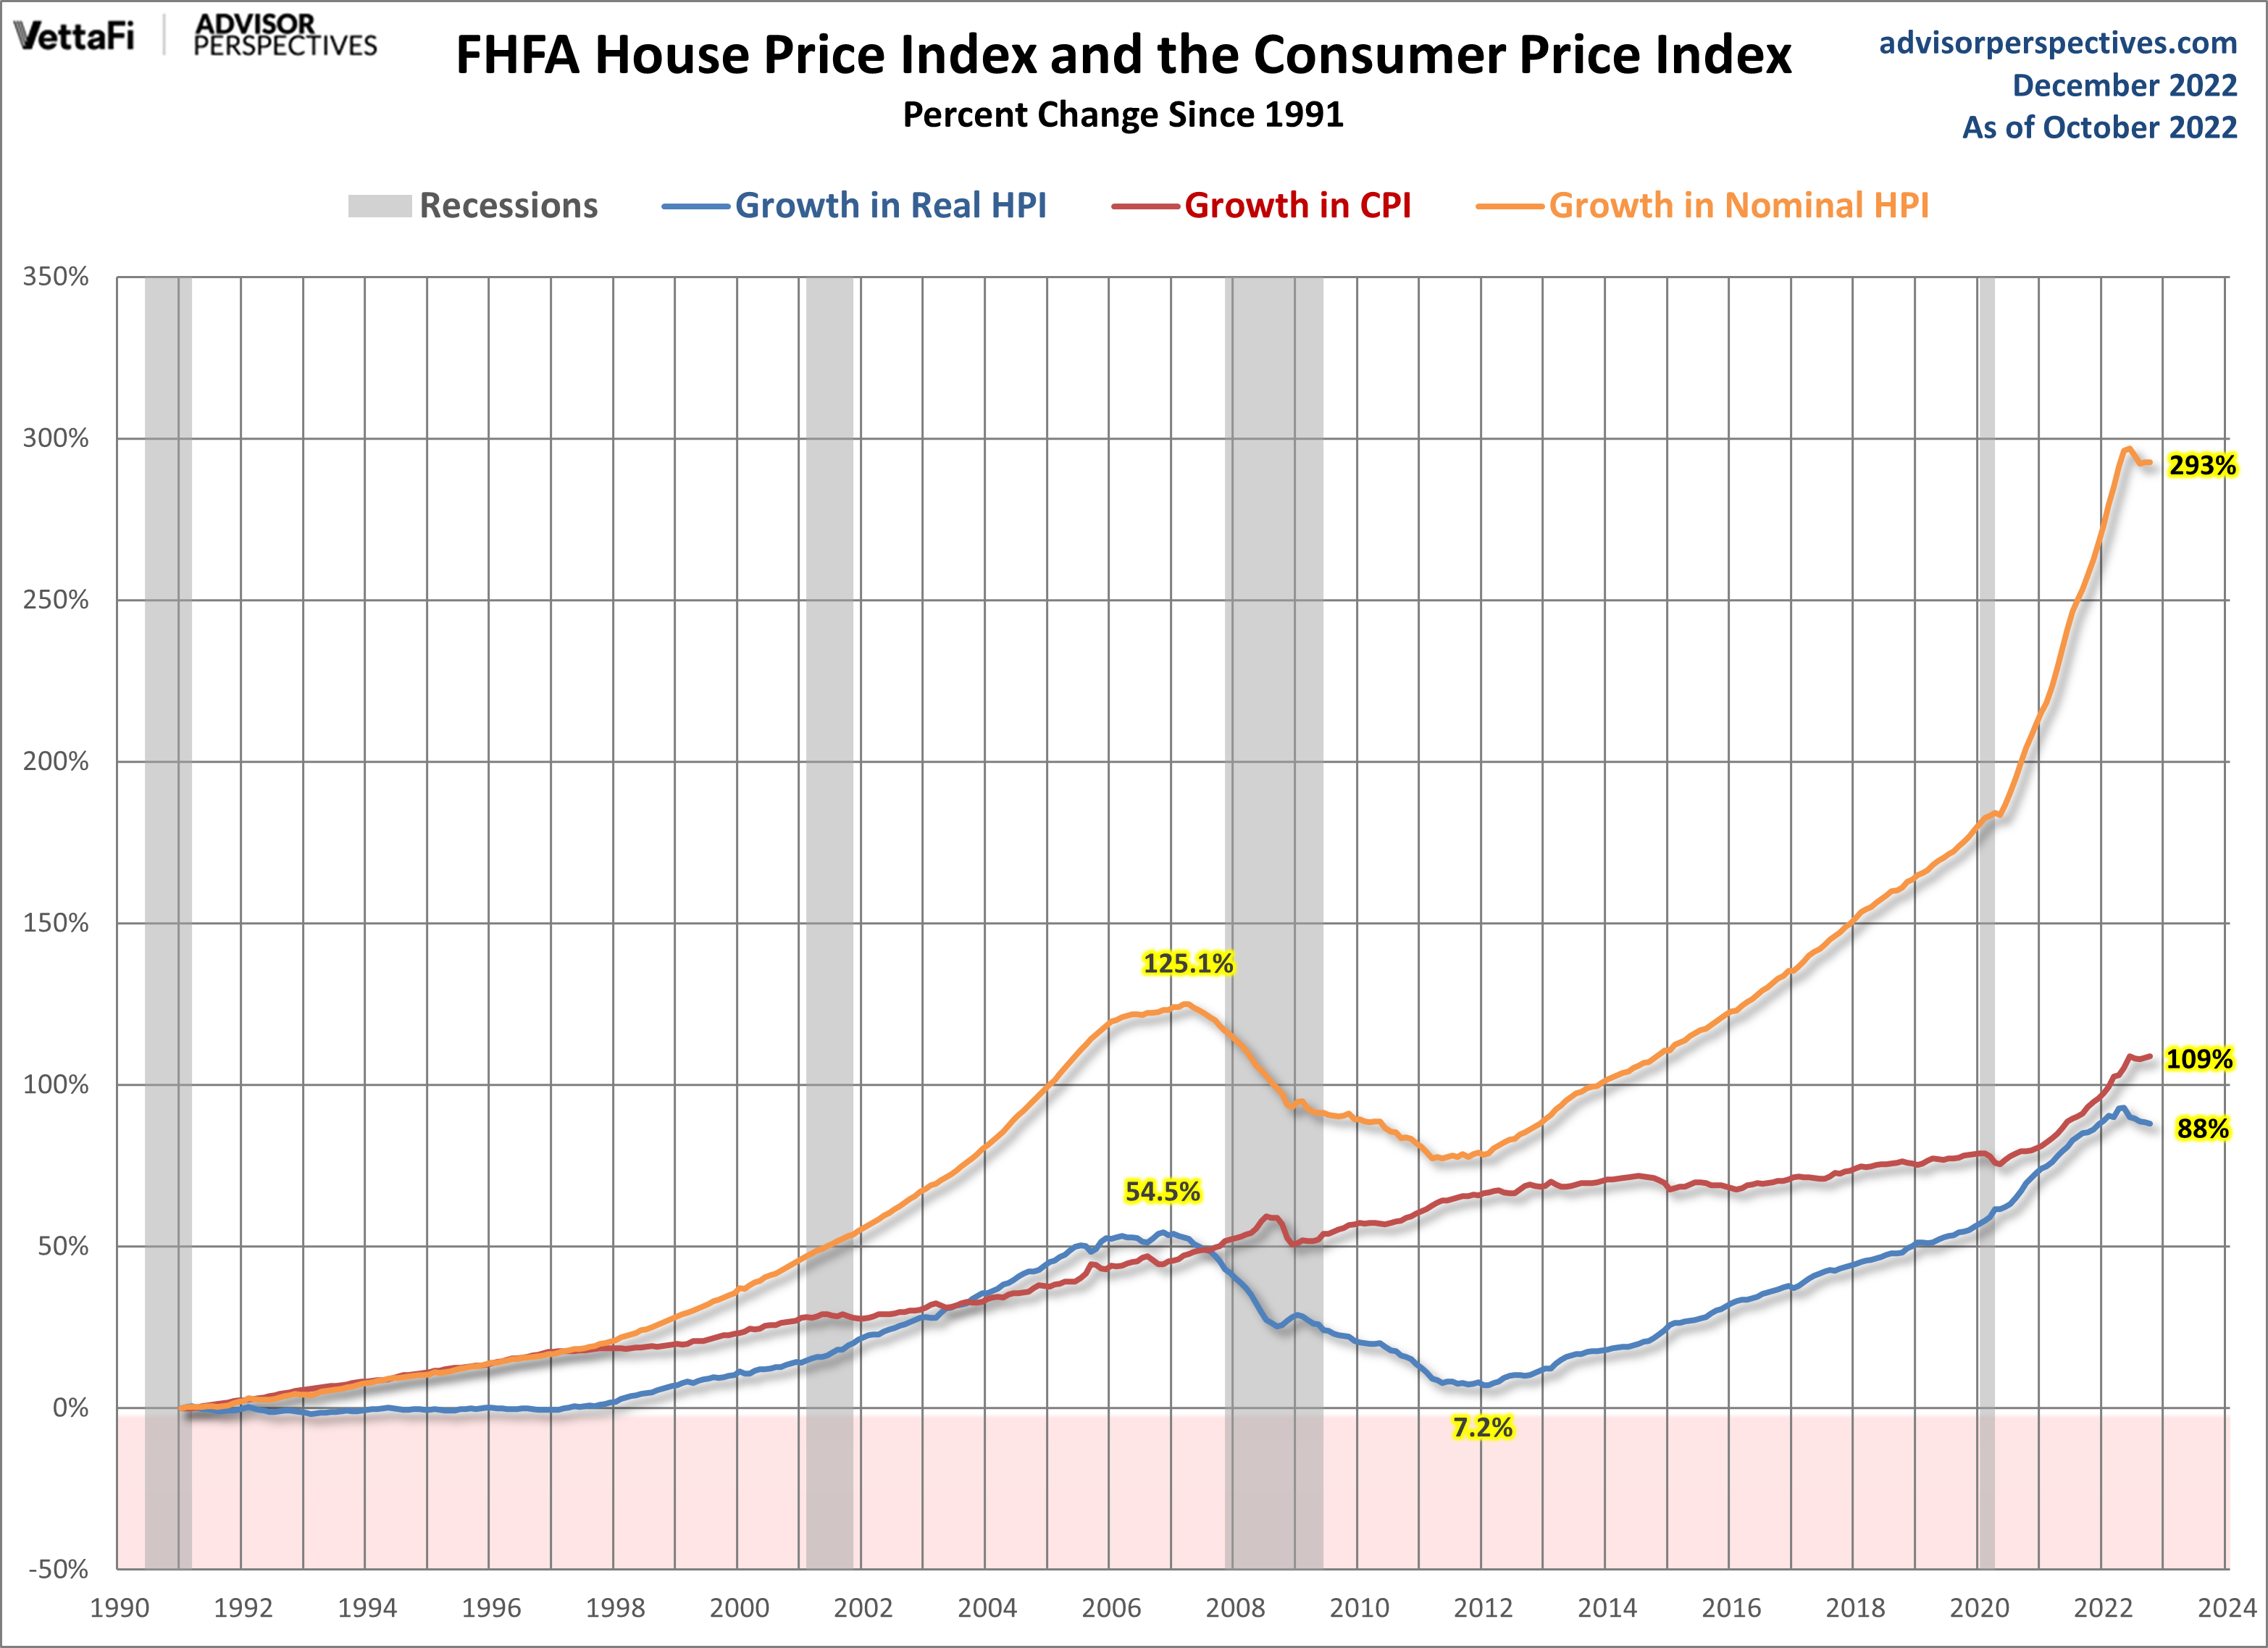
Here we compare the Consumer Price Index for All Urban Consumers to both the Nominal and Real House Price Index, which is a similar comparison to what we do in our Case-Shiller update. Nominal HPI growth has clearly taken off since 2012. However, when adjusted for inflation, the House Price Index has not seen as dramatic increase since the late 1990s.
More By This Author:
The Big Four: Real Personal Income In NovemberKansas City Fed Mfg Survey: Activity Declines At Faster Rate
Michigan Consumer Sentiment Up 5% In December


Comments
Log in or sign up to join the conversation.