
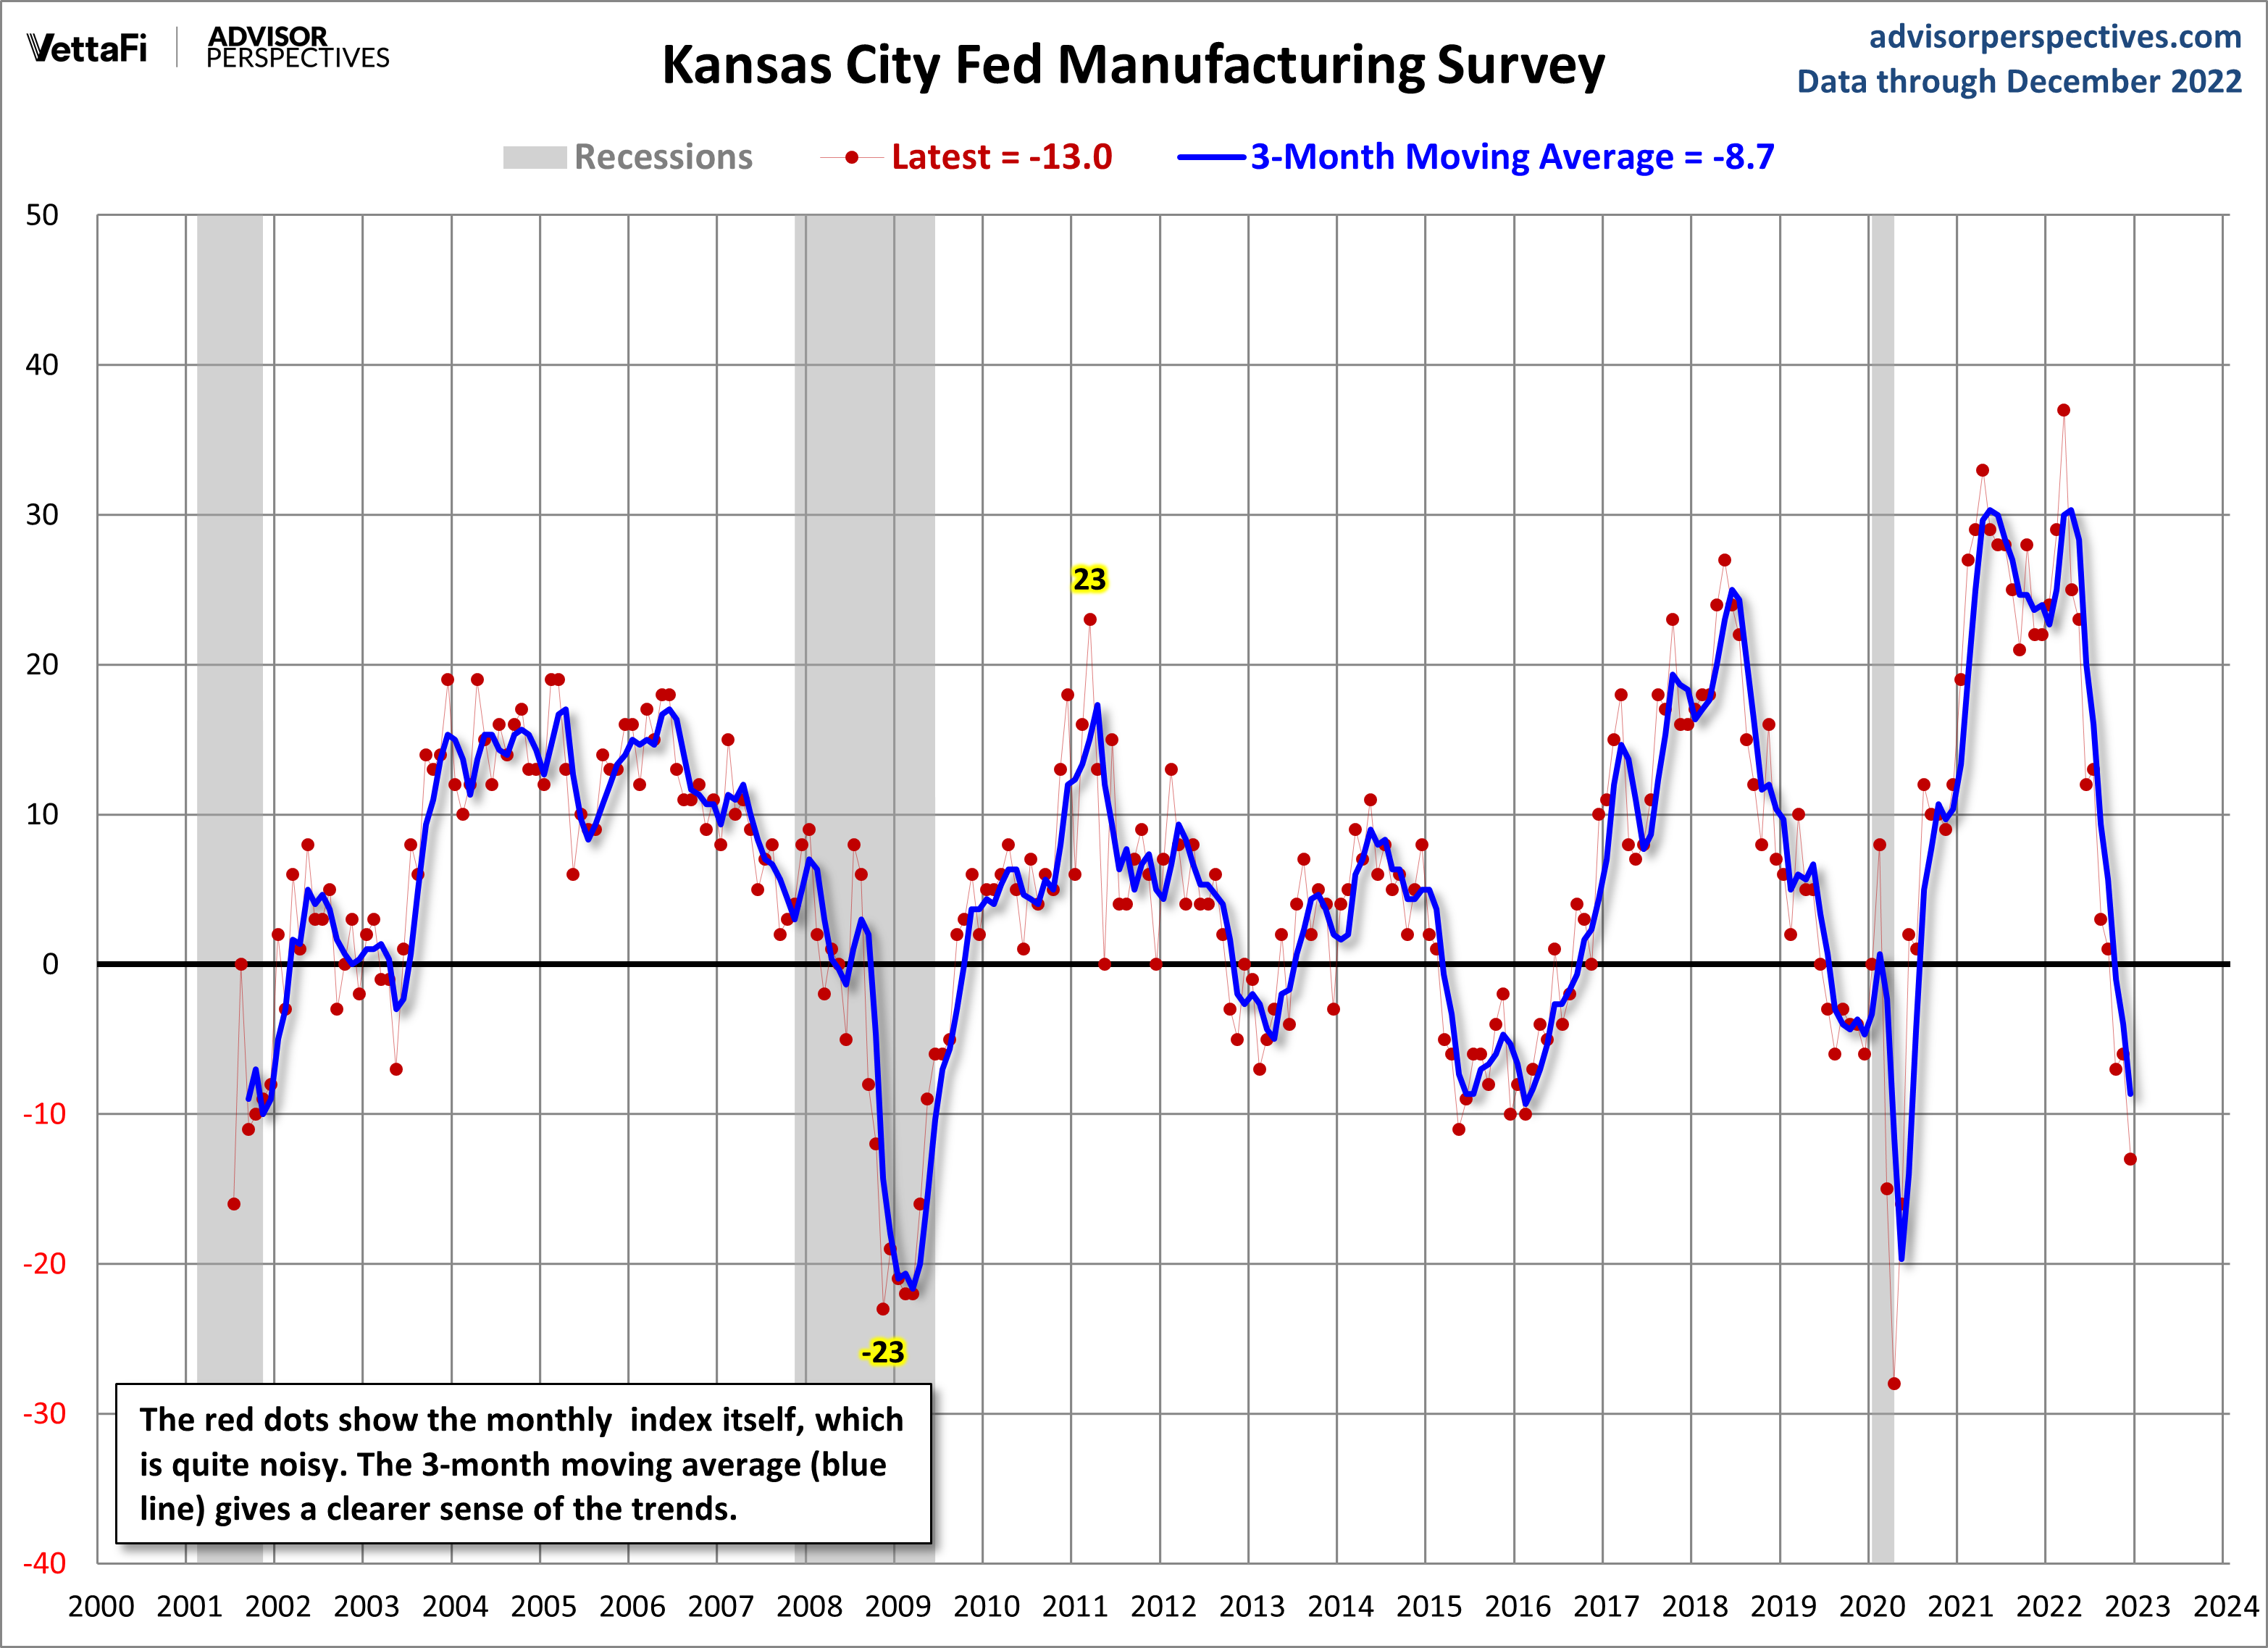
The latest index came in at -13, down 7 from last month, indicating continued contraction in December. The future outlook inched up to 2. All figures are seasonally adjusted. Here is a snapshot of the complete Kansas City Fed Manufacturing Survey.
Quarterly data for this indicator dates back to 1995, but monthly data is only available from 2001.
Here is an excerpt from the latest report:
Tenth District manufacturing activity declined at a slightly faster pace than last month, while expectations for future activity were mostly flat or slightly positive (Chart 1, Tables 1 & 2). The monthly index of raw materials prices continued to slow in December, but materials prices were still higher than a year ago at most firms and expected to rise moderately in the months ahead. Finished goods price increases were also smaller than last month and more firms than in previous surveys anticipated further easing.
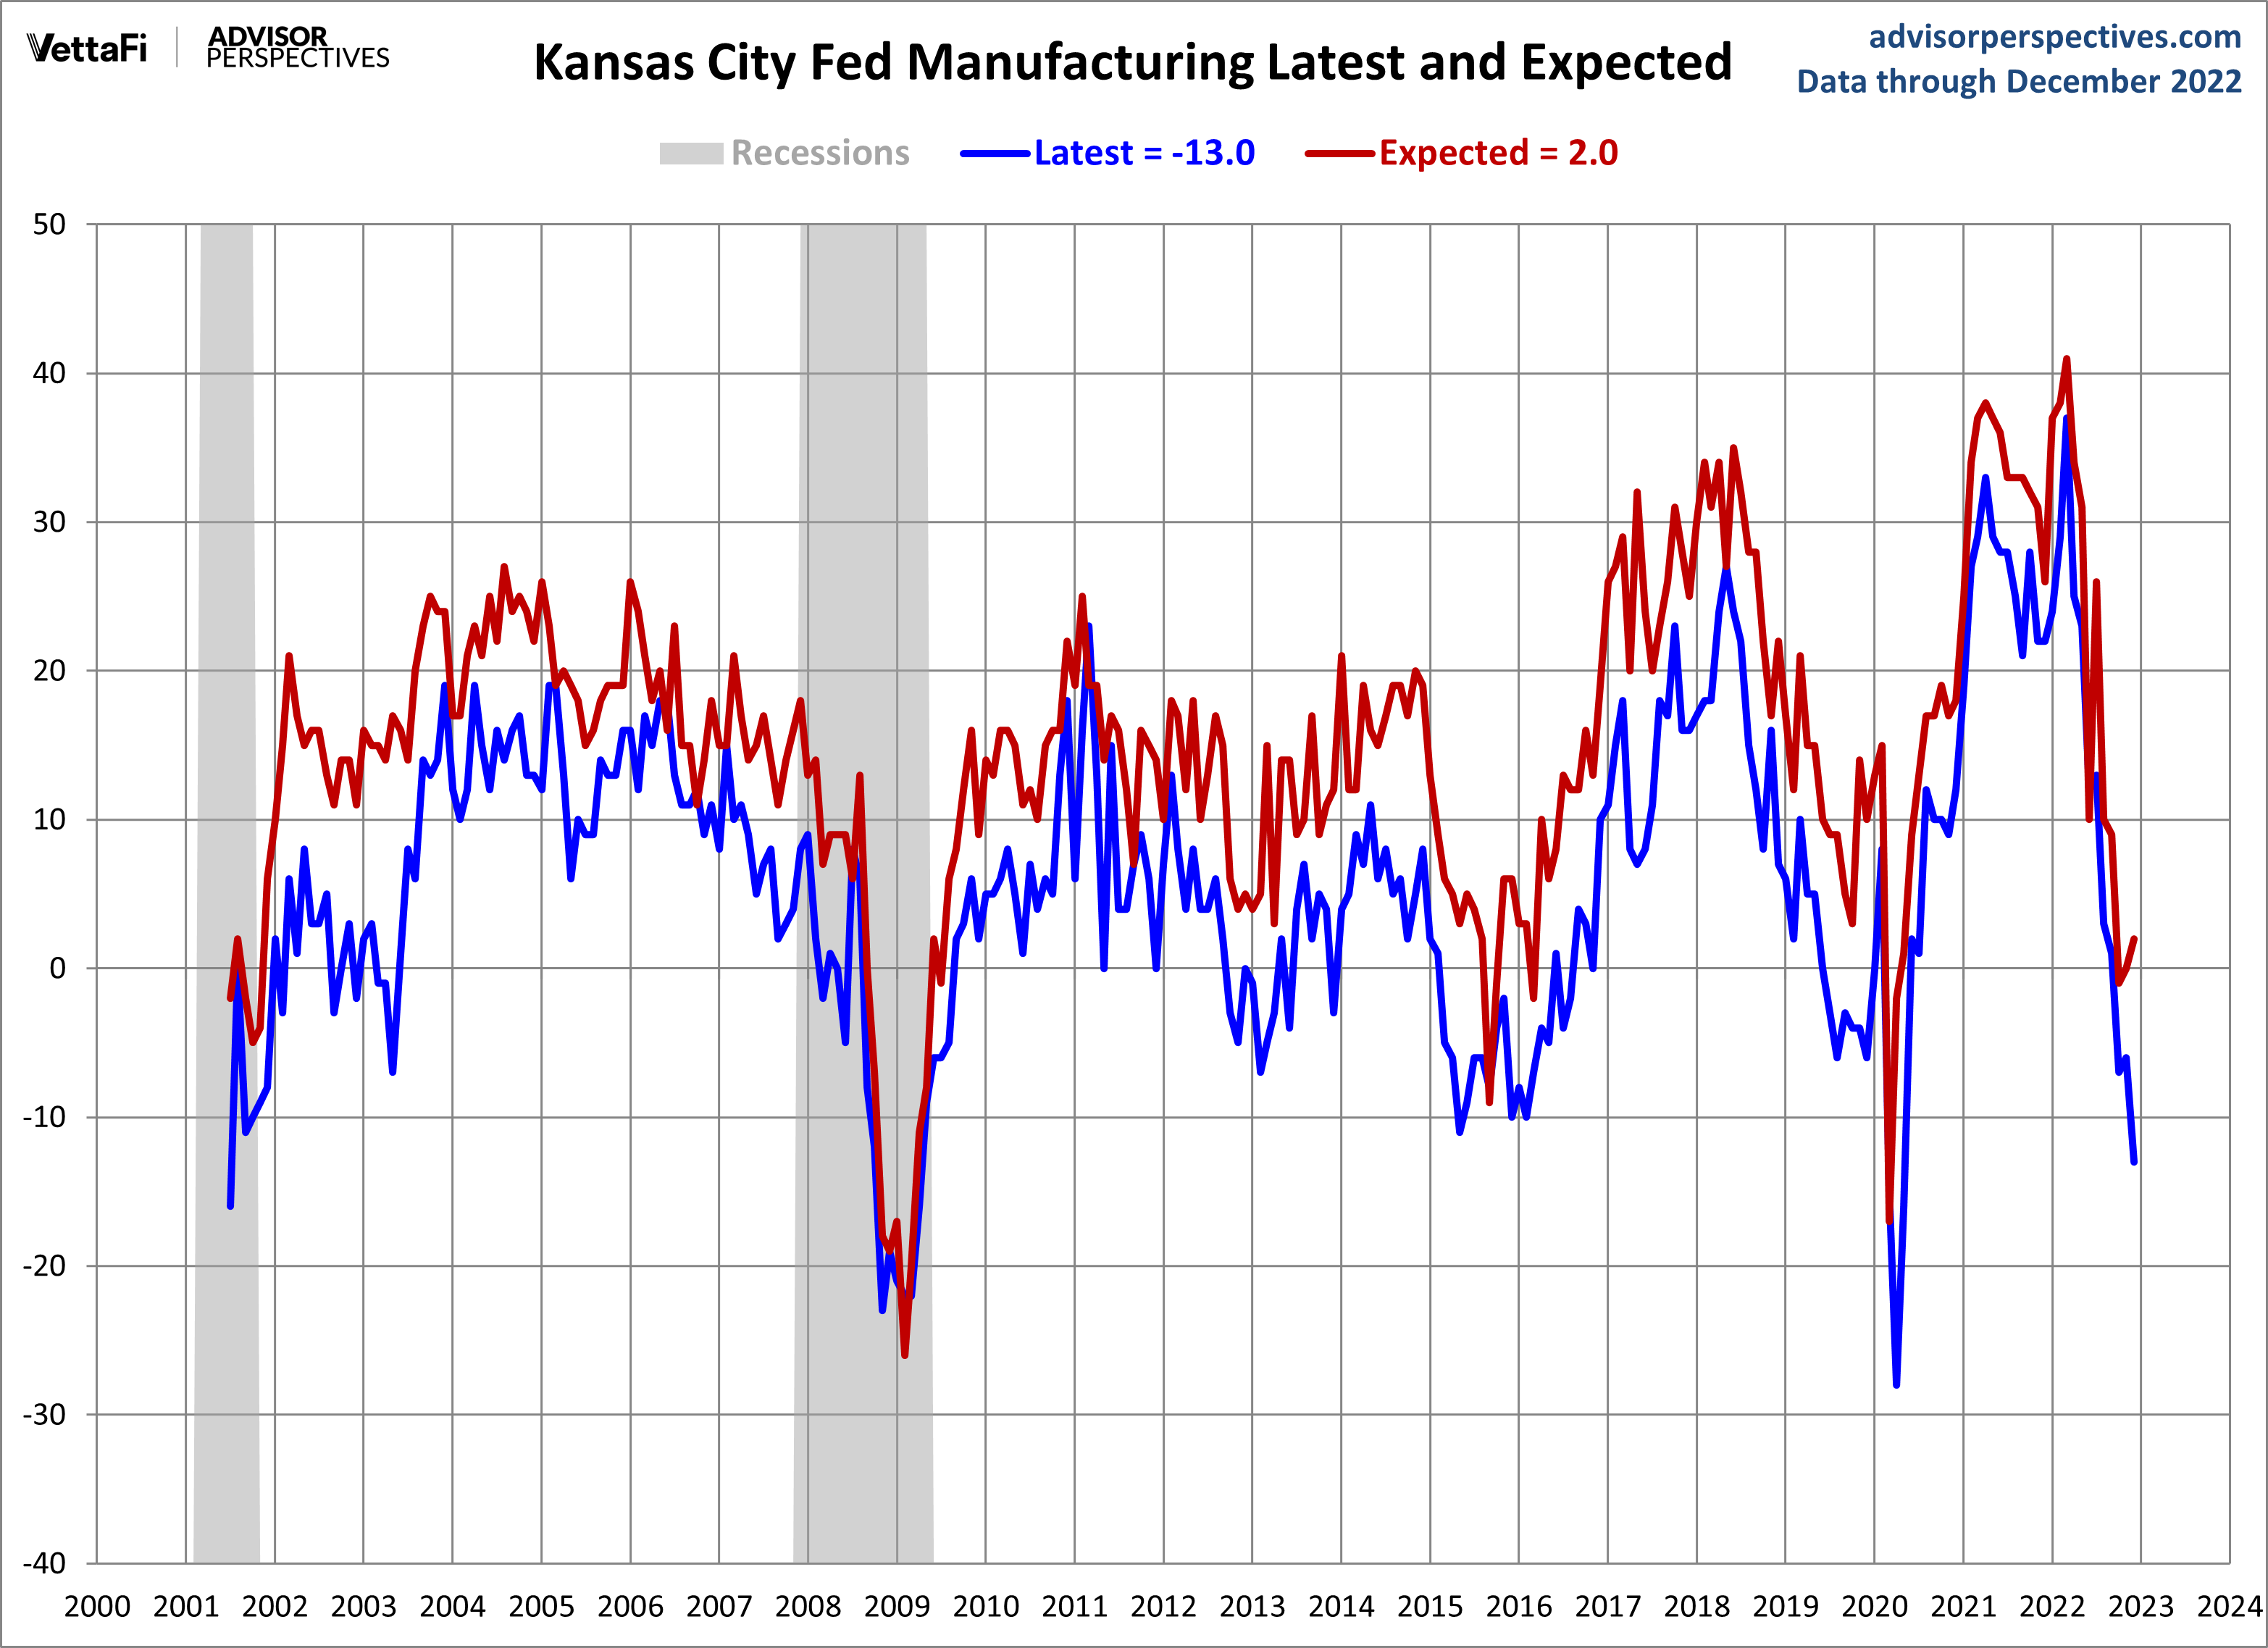
The month-over-month composite index was -9 in December, down from -6 in November and -7 in October (Tables 1 & 2). The composite index is an average of the production, new orders, employment, supplier delivery time, and raw materials inventory indexes. The slower pace in factory growth in December was driven by decreased activity in printing, wood products, machinery manufacturing, and food manufacturing. Month-over-month indexes were mostly negative in December. The monthly employment index fell from 3 to 0, its lowest level since 2020 but still indicative of flat employment for the month. Indexes for year-over-year factory activity slowed slightly in December, including the composite index, which decreased from 19 to 15. The future composite index increased from 0 to 2 in December, with the expected volume of new orders index also moving into positive territory for the first time in two months.
Here is a snapshot of the complete Kansas City Fed Manufacturing Survey.
The next chart is an overlay of the general and future outlook indexes — the outlook six months ahead. Future factory indexes inched up to 2.
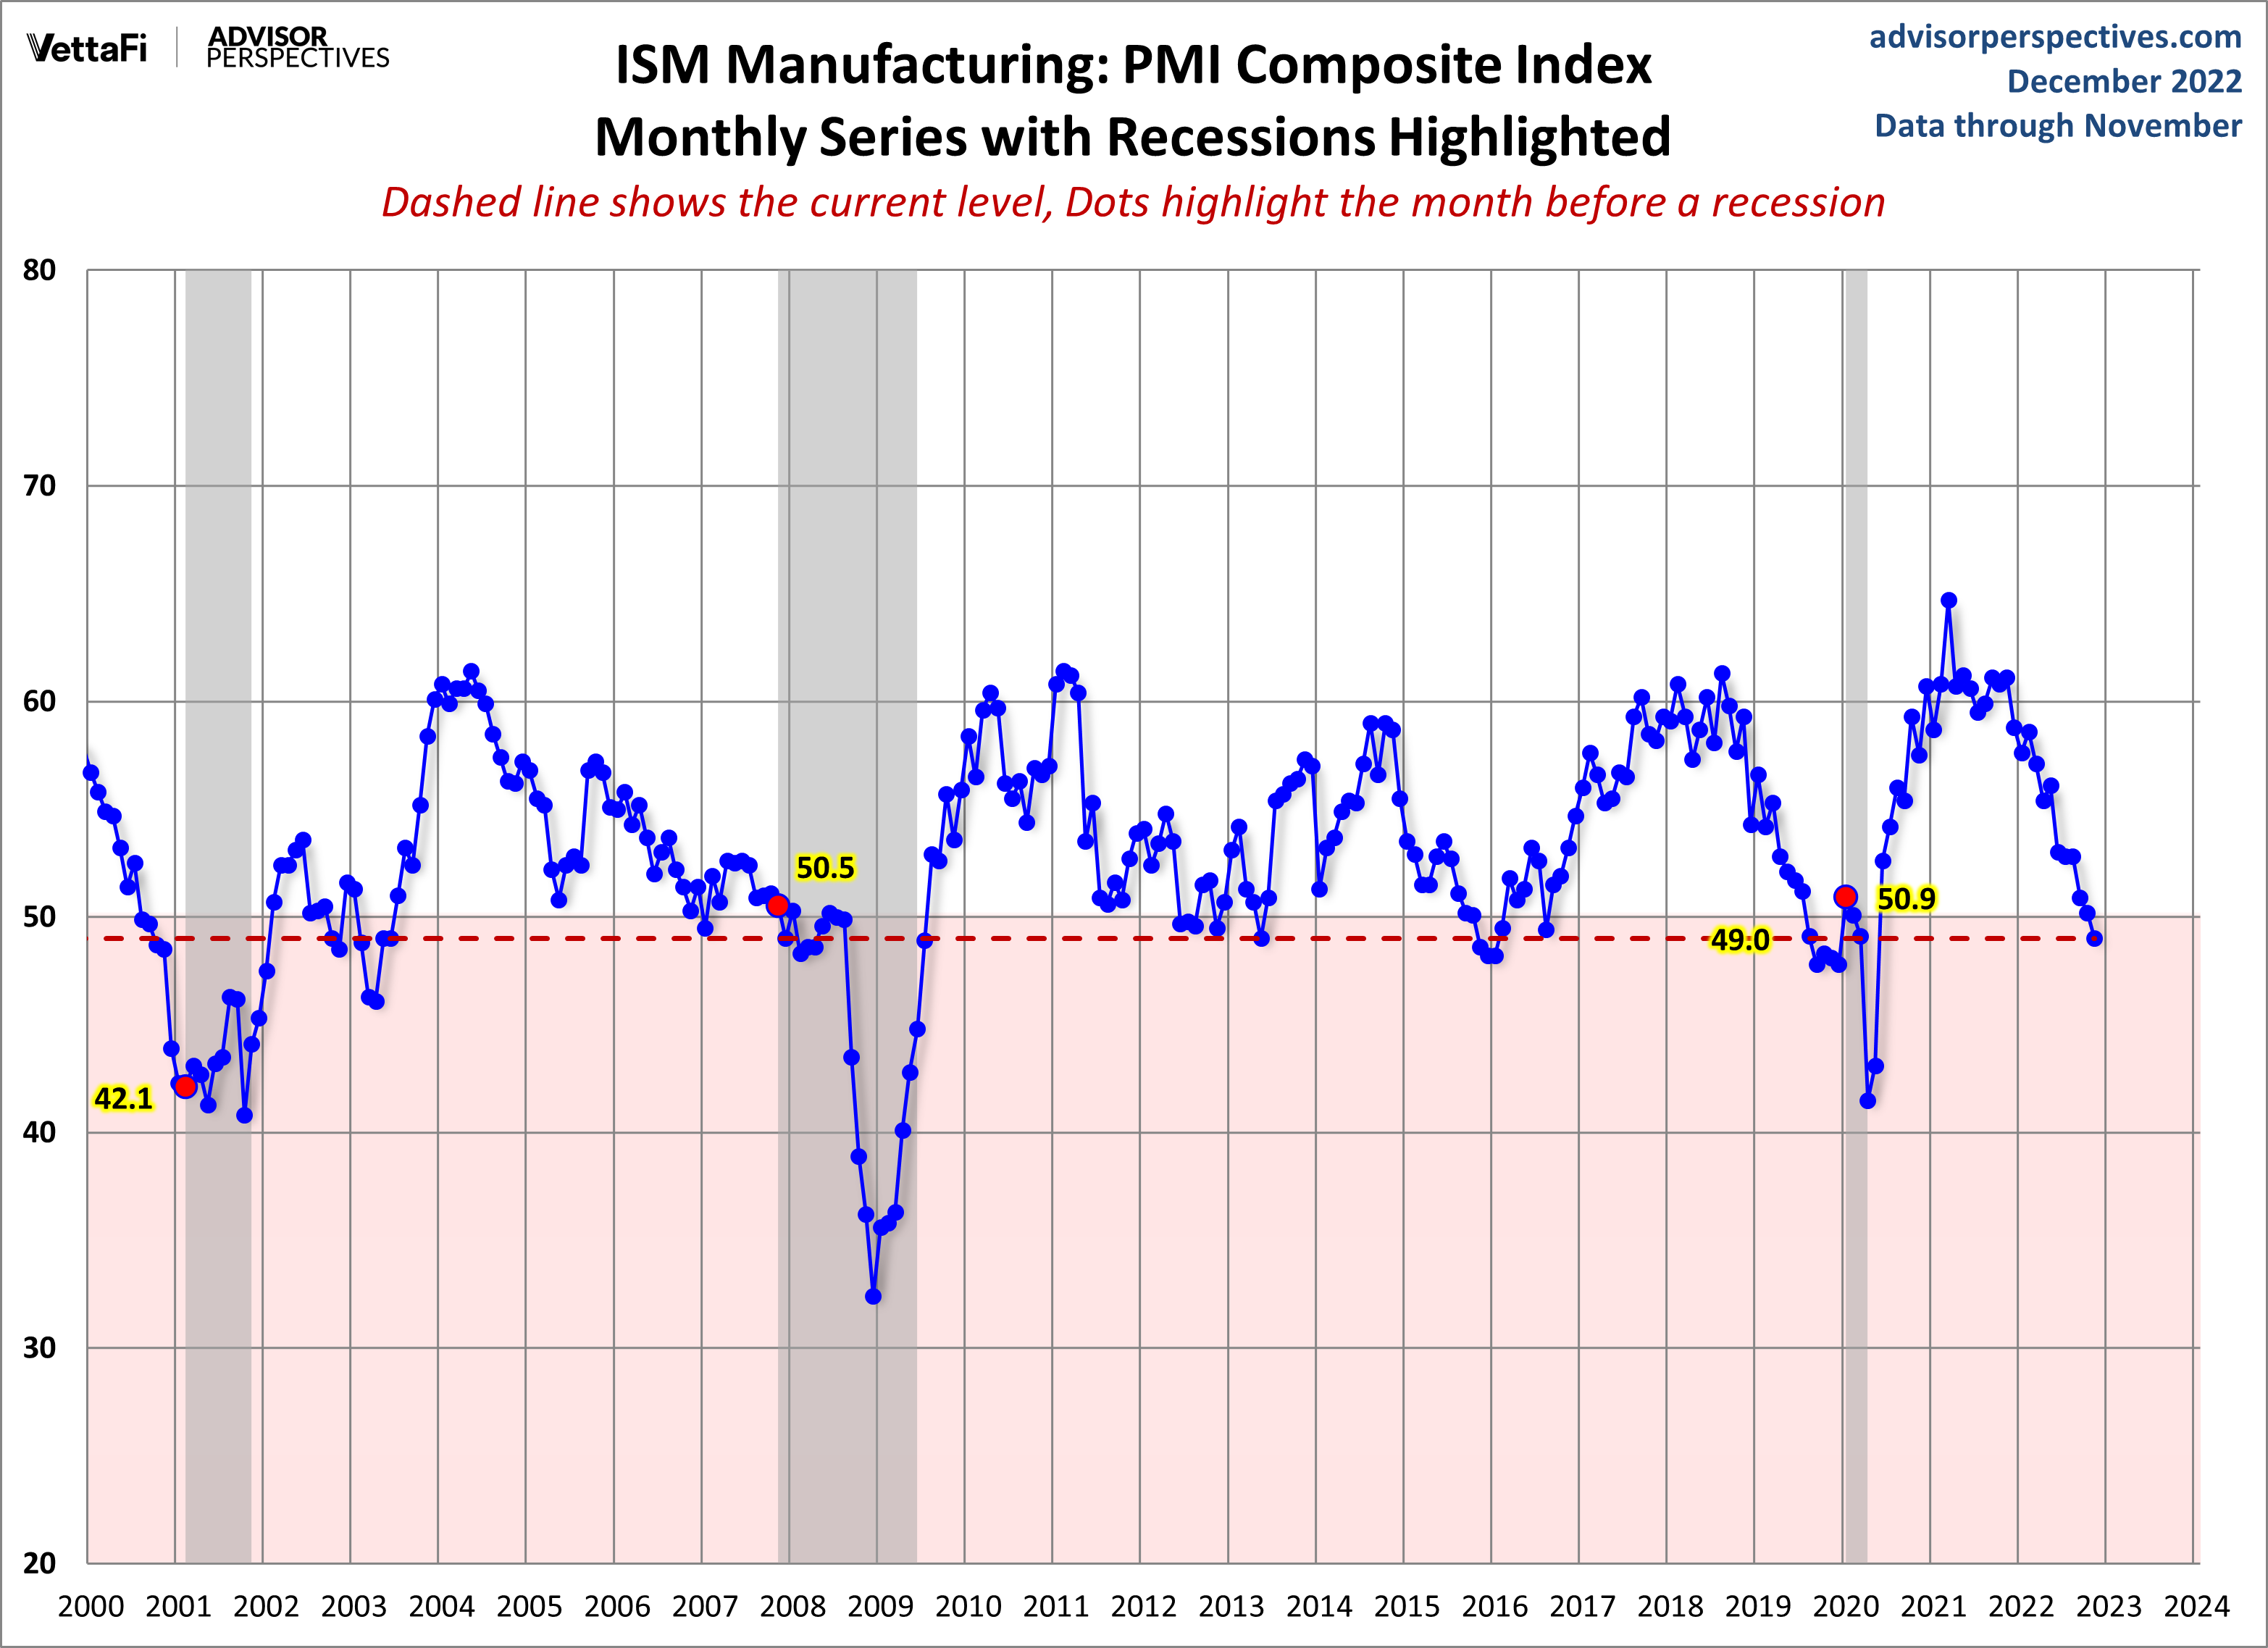
For comparison, here is the latest ISM Manufacturing survey.
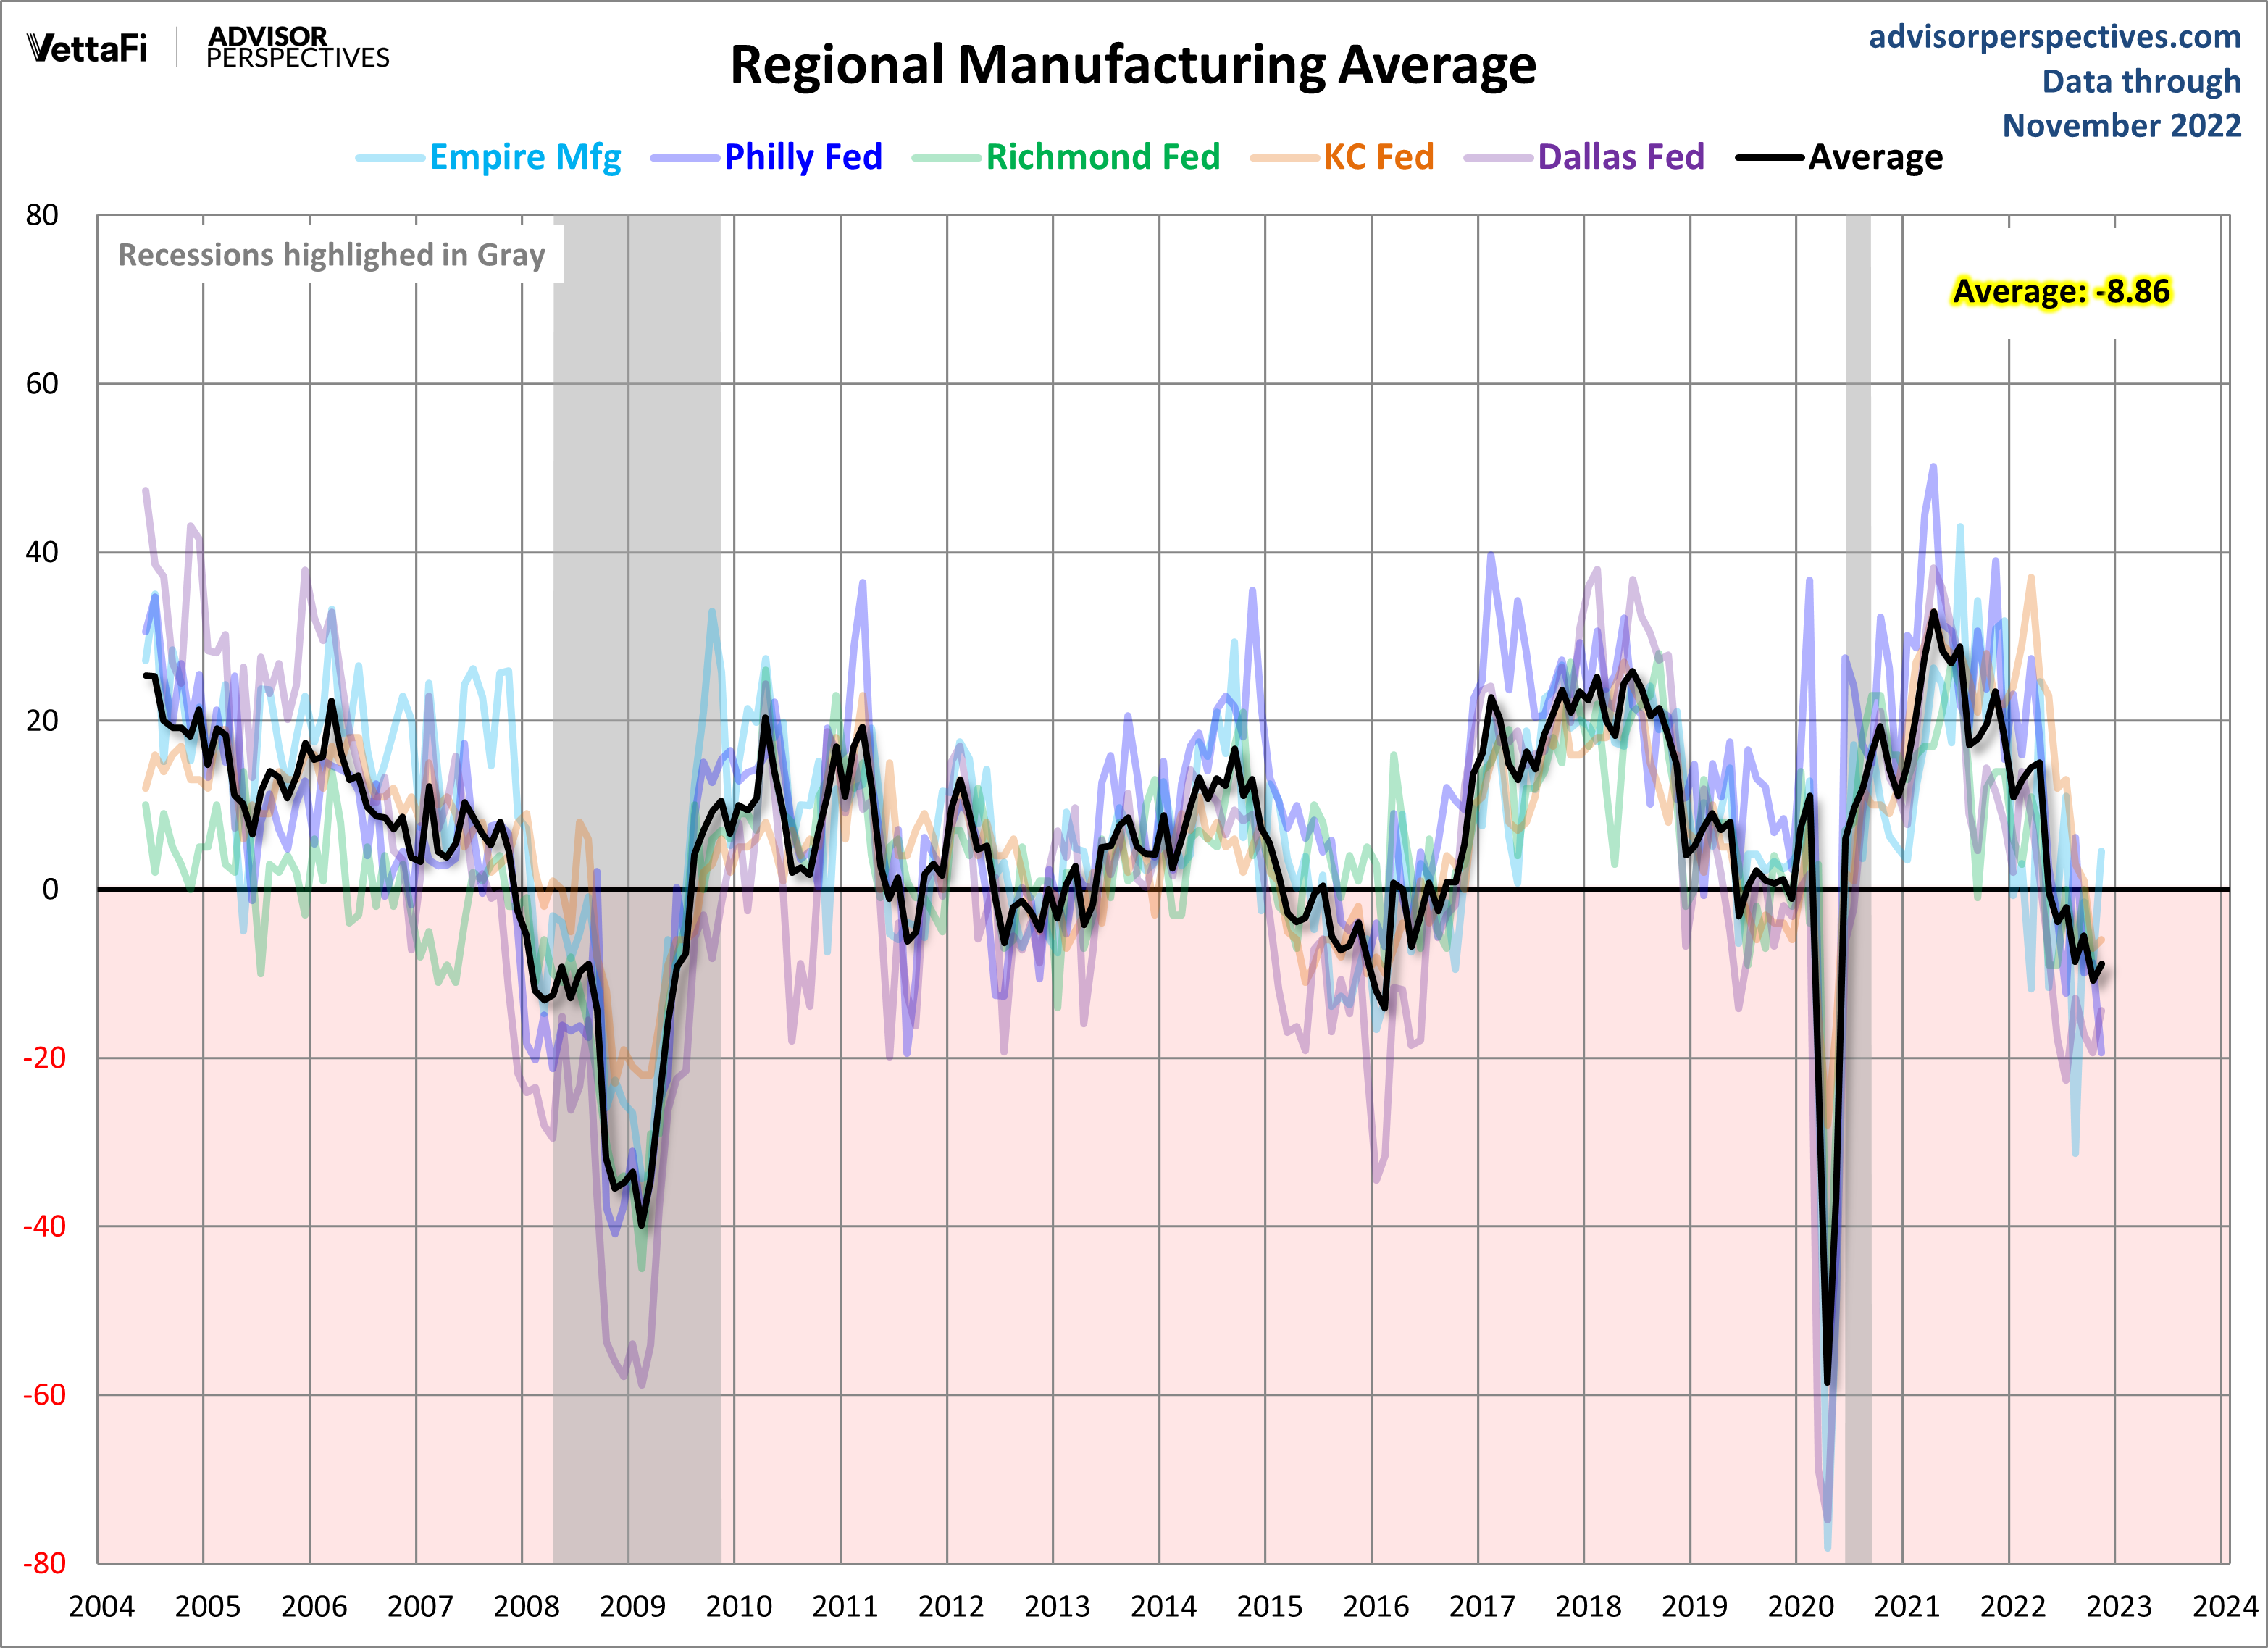
Let's compare all five Regional Manufacturing indicators. Here is a three-month moving average overlay of each since 2001 (for those with data).
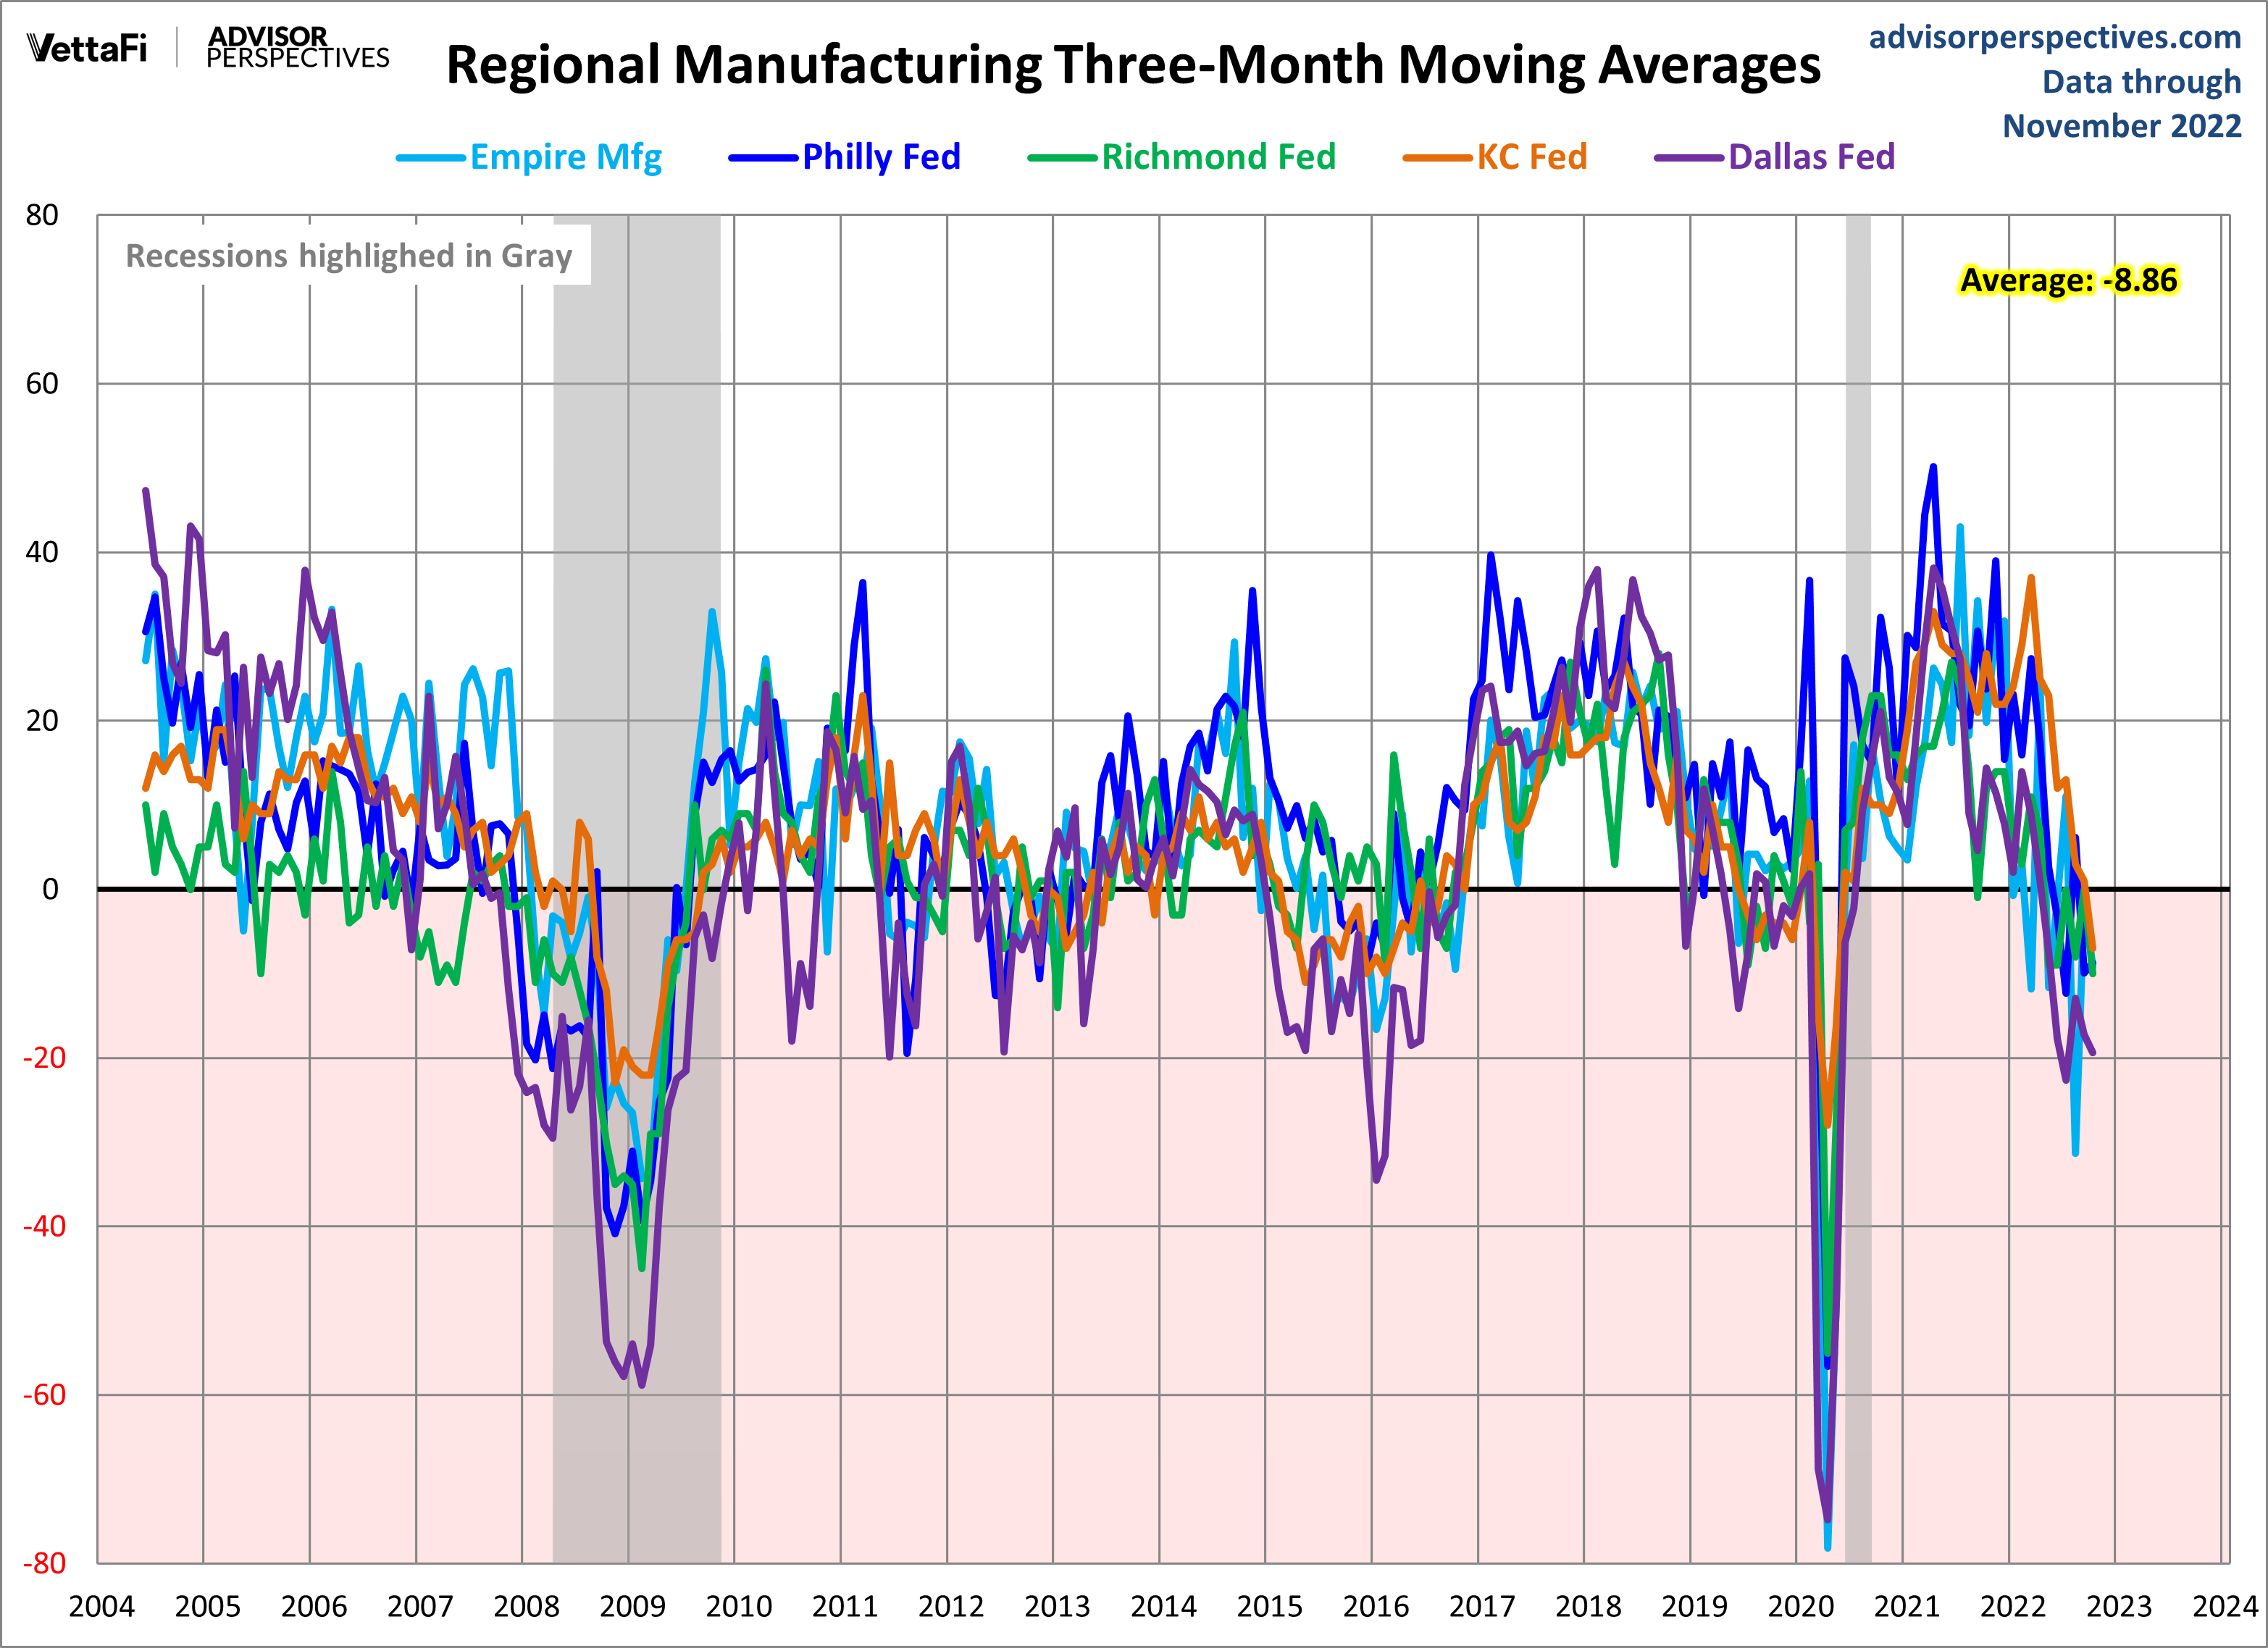
Here is the same chart including the average of the five.
More By This Author:
Michigan Consumer Sentiment Up 5% In DecemberPCE Price Index: November Headline At 5.5% YoY
Margin Debt Down 0.9% In November


Comments
Log in or sign up to join the conversation.