
VPA Signs On The SPY
(Click on image to enlarge)
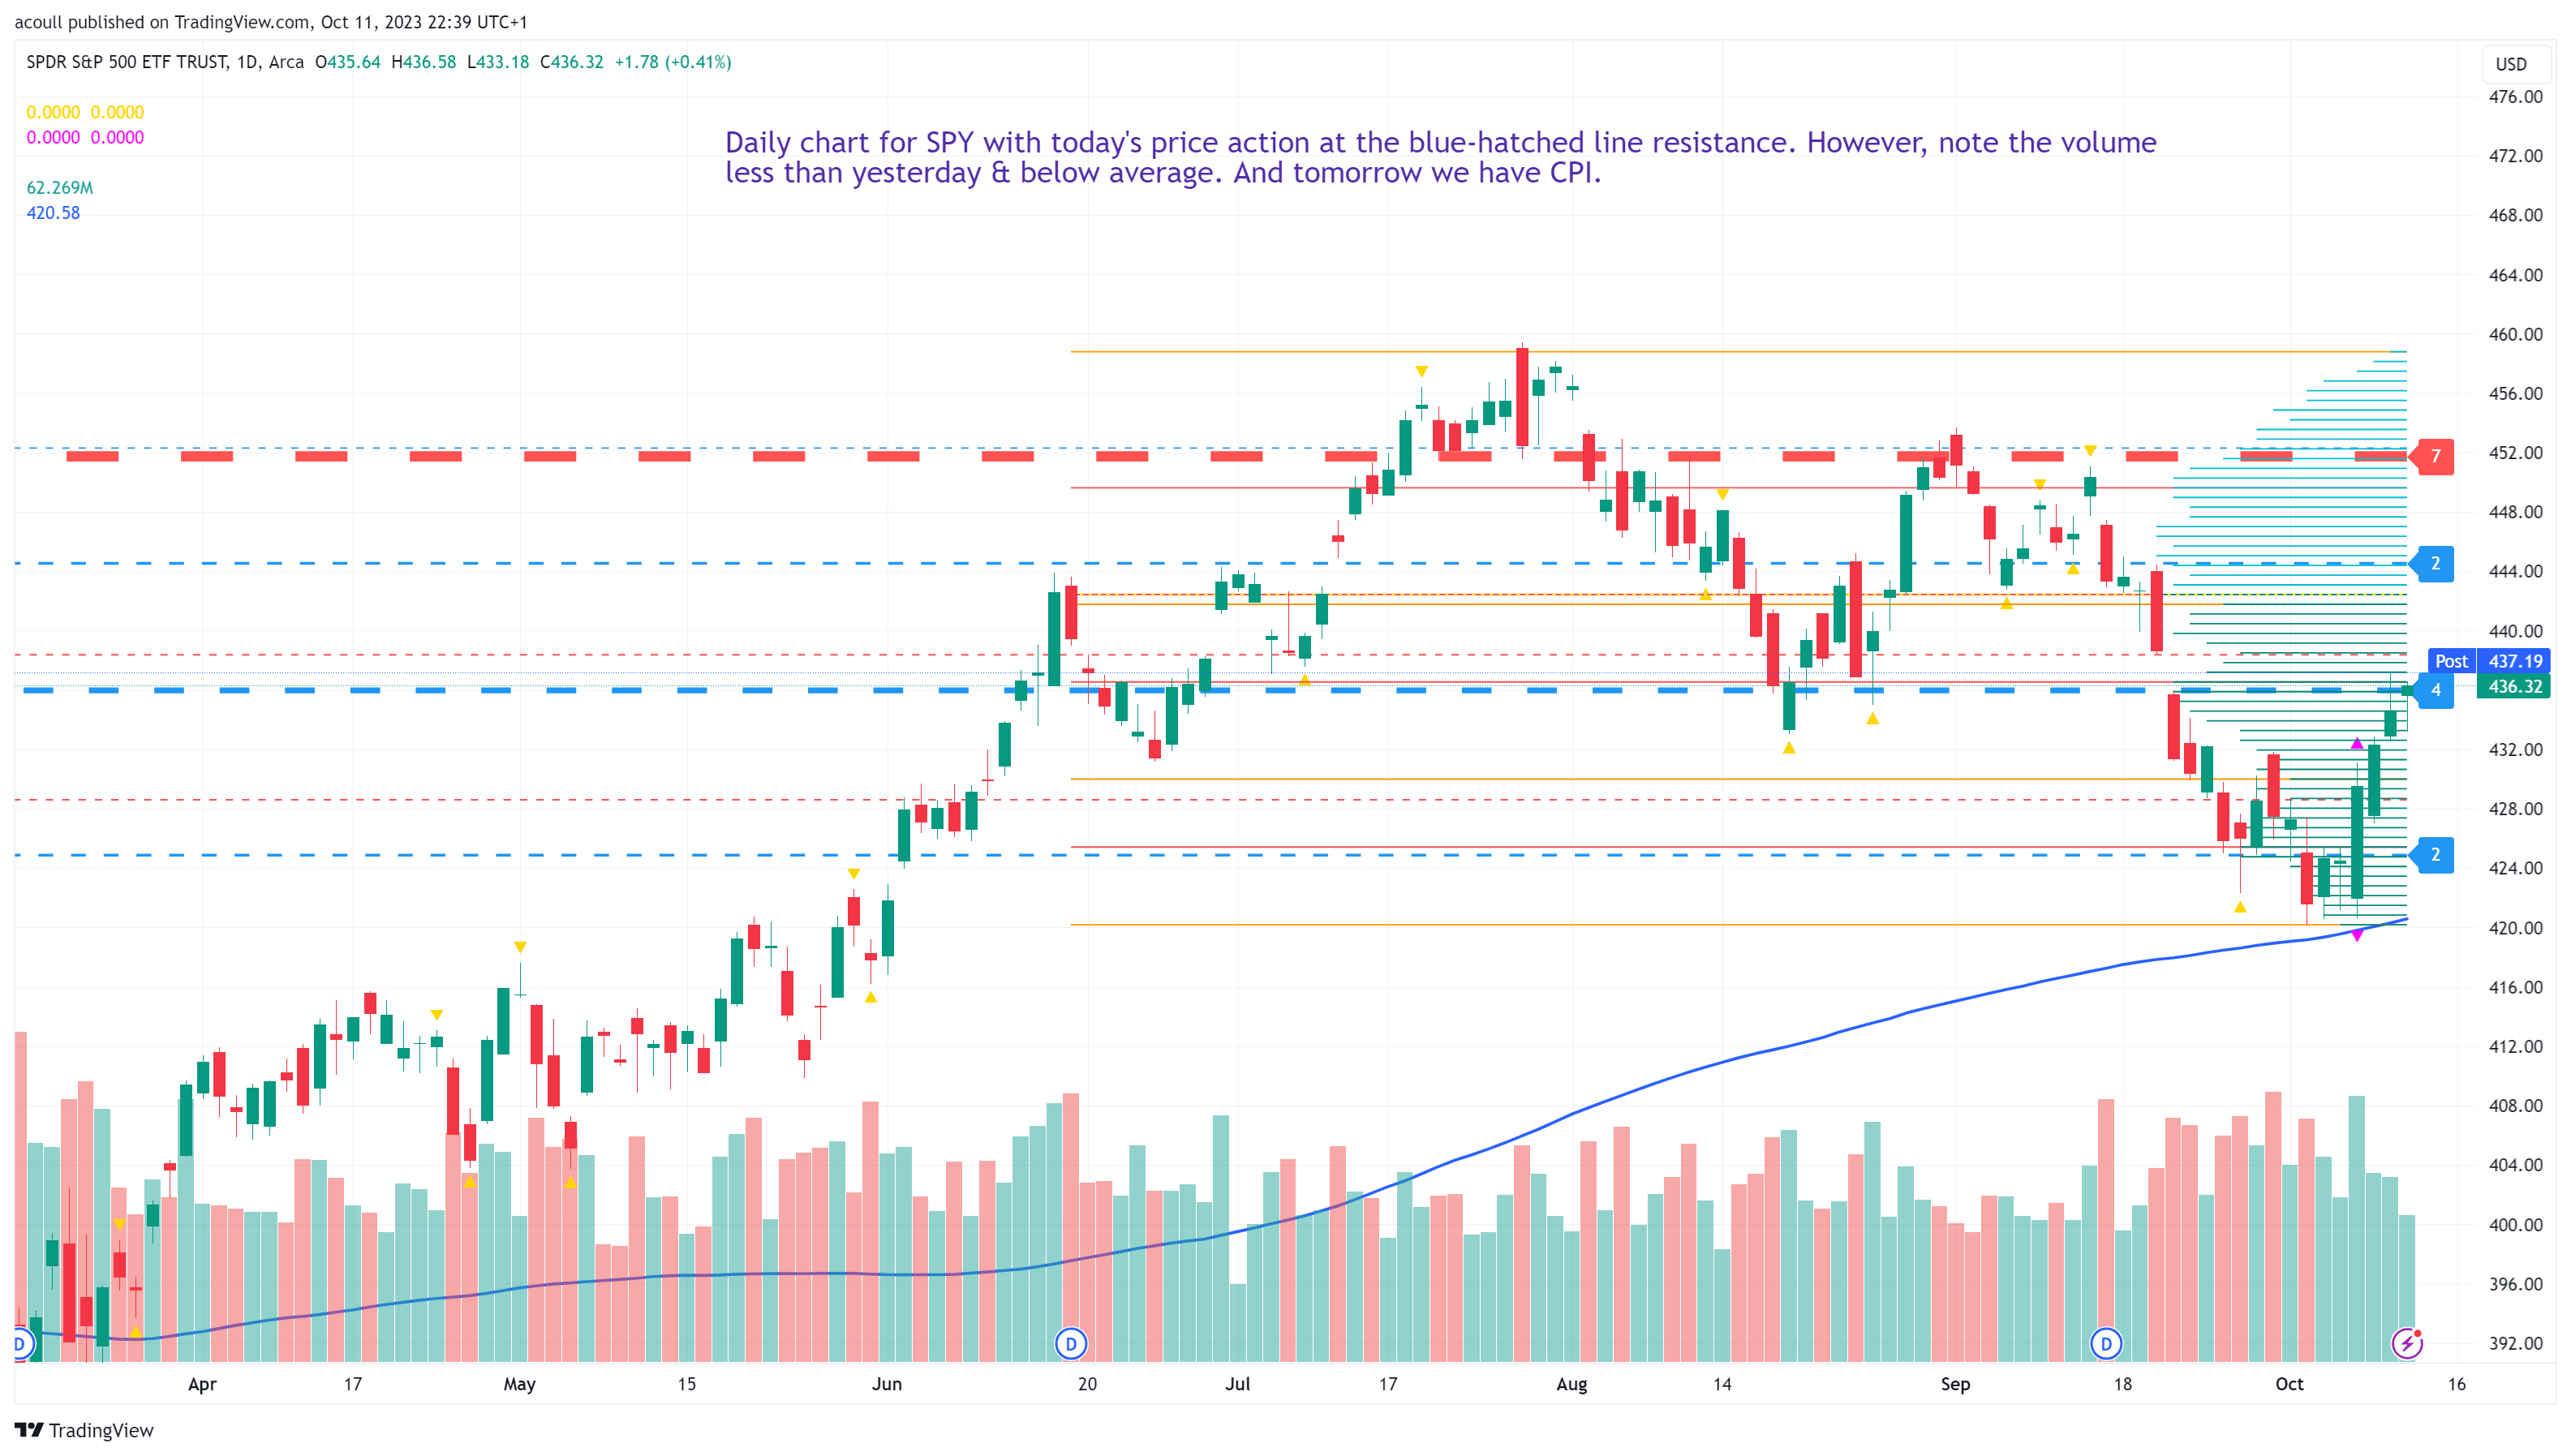
I’ve been commenting on the SPY on my X-feed, and yesterday’s highlighted how we should be watching the volume on the daily chart, given how volume has been falling as prices moved higher while trying to break through a strong resistance line (see chart). It seems that signal is playing out as I write, triggered by a dreadful 30-year bond auction where lackluster demand forced yields much higher than anticipated. As someone commented on X, it’s not so much the economy but the deficit, particularly as the markets appeared to shrug off a higher-than-expected CPI print earlier in the session.
(Click on image to enlarge)

A rise in yields also triggered a sharp move higher in volatility, as reflected not only in the VIX but also in the UVIX ETF – which is a 2 x long VIX futures ETF that, as a leveraged product, reacts more strongly. The EFT has been sinking lower as equities continue to hold up, only occasionally spiking higher on pullbacks. This afternoon’s move has been the strongest for a while. As a reminder, the VIX and related volatility products are inversely correlated with equities. In other words, when equities rise, the VIX et al. move lower as market participants become complacent but spike higher when market mood sours. We also have to remember volatility, of course, is mean reverting, so the volatility indices will tend to return to average levels as extreme price moves are difficult to sustain.
Whether this afternoon’s jolt in market sentiment is the first significant stage in a broader market sell-off remains to be seen and will be signaled in the slower time frames. However, other factors to consider include the shocking market breadth data, which I have also highlighted on my X-feed. There are various ways to measure market breadth, and one of the most popular is to consider how many stocks are above or below key moving averages, such as the 50 and 200. To give you an example, in the S&P500, only 39% of stocks are above their 200 ma and 24% above their 50 ma. This begs the question of why the indices have continued rising, and the answer lies in their construction. In other words, most are market cap, so the biggest companies and their associated sectors carry the most weight. For the S&P500, this breaks down to what the media has dubbed the ‘Magnificant 7’, namely Apple, Microsoft, Google, Amazon, Nvidia, Meta & Tesla, which together make up almost 30% of the index. If they do well, so does the index, but if they falter, the entire index & market will falter.
(Click on image to enlarge)

Moving to today’s 5-minute chart, we can see the waterfall. lower has come to a halt, with stopping volume coming in at the $431 level on the SPY, followed by a fall in selling volume and a nice engulfing candle on high volume as the ETF attempts to climb higher, proving once again how prices take the stairs up and the elevator down!
Today’s burst of volatility is likely to be only the beginning, as we are in earnings season, which starts in earnest tomorrow with United Health and banks such as JP Morgan, Wells Fargo, and Citigroup reporting, while next week we have a slew of big caps including Tesla and Netflix. Plus, next Thursday 19th, is also the anniversary of Black Monday.
More By This Author:
Is The XLK Pointing To The September Effect On Stocks?SPY & QQQ – A Tale Of Two EFTs
Waiting For Tech
Disclaimer: Futures, stocks, and spot currency trading have large potential rewards, but also large potential risk. You must be aware of the risks and be willing to accept them in order to invest in ...
more

