
(Click on image to enlarge)
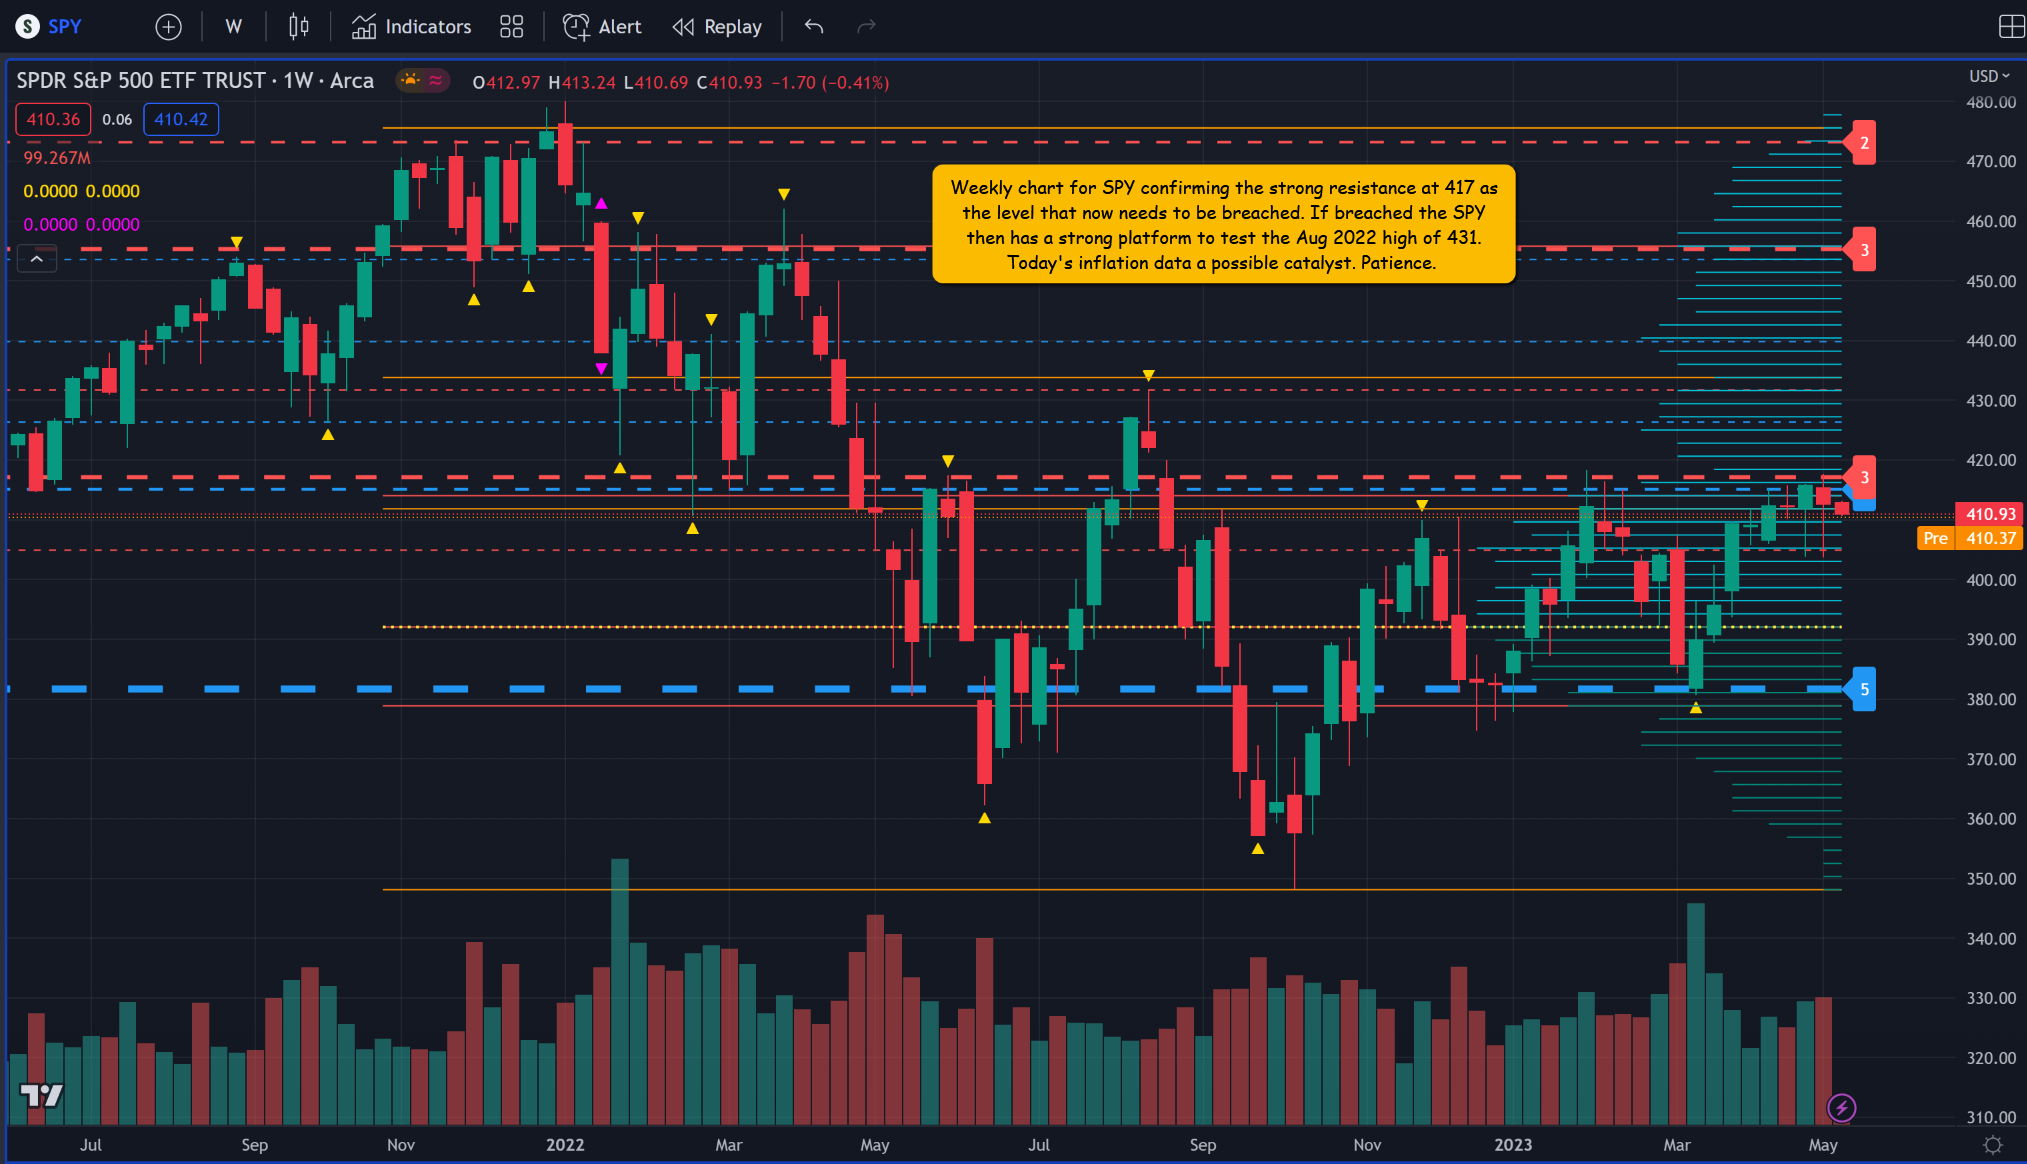
Some interesting divergence between the SPY & QQQ, with the former developing some strong resistance levels on the weekly chart (see chart below) while the latter only facing some very minor resistance at 324. This is unusual as both ETFs have a 0.86 correlation which is high and indicates a strong positive relationship.
(Click on image to enlarge)
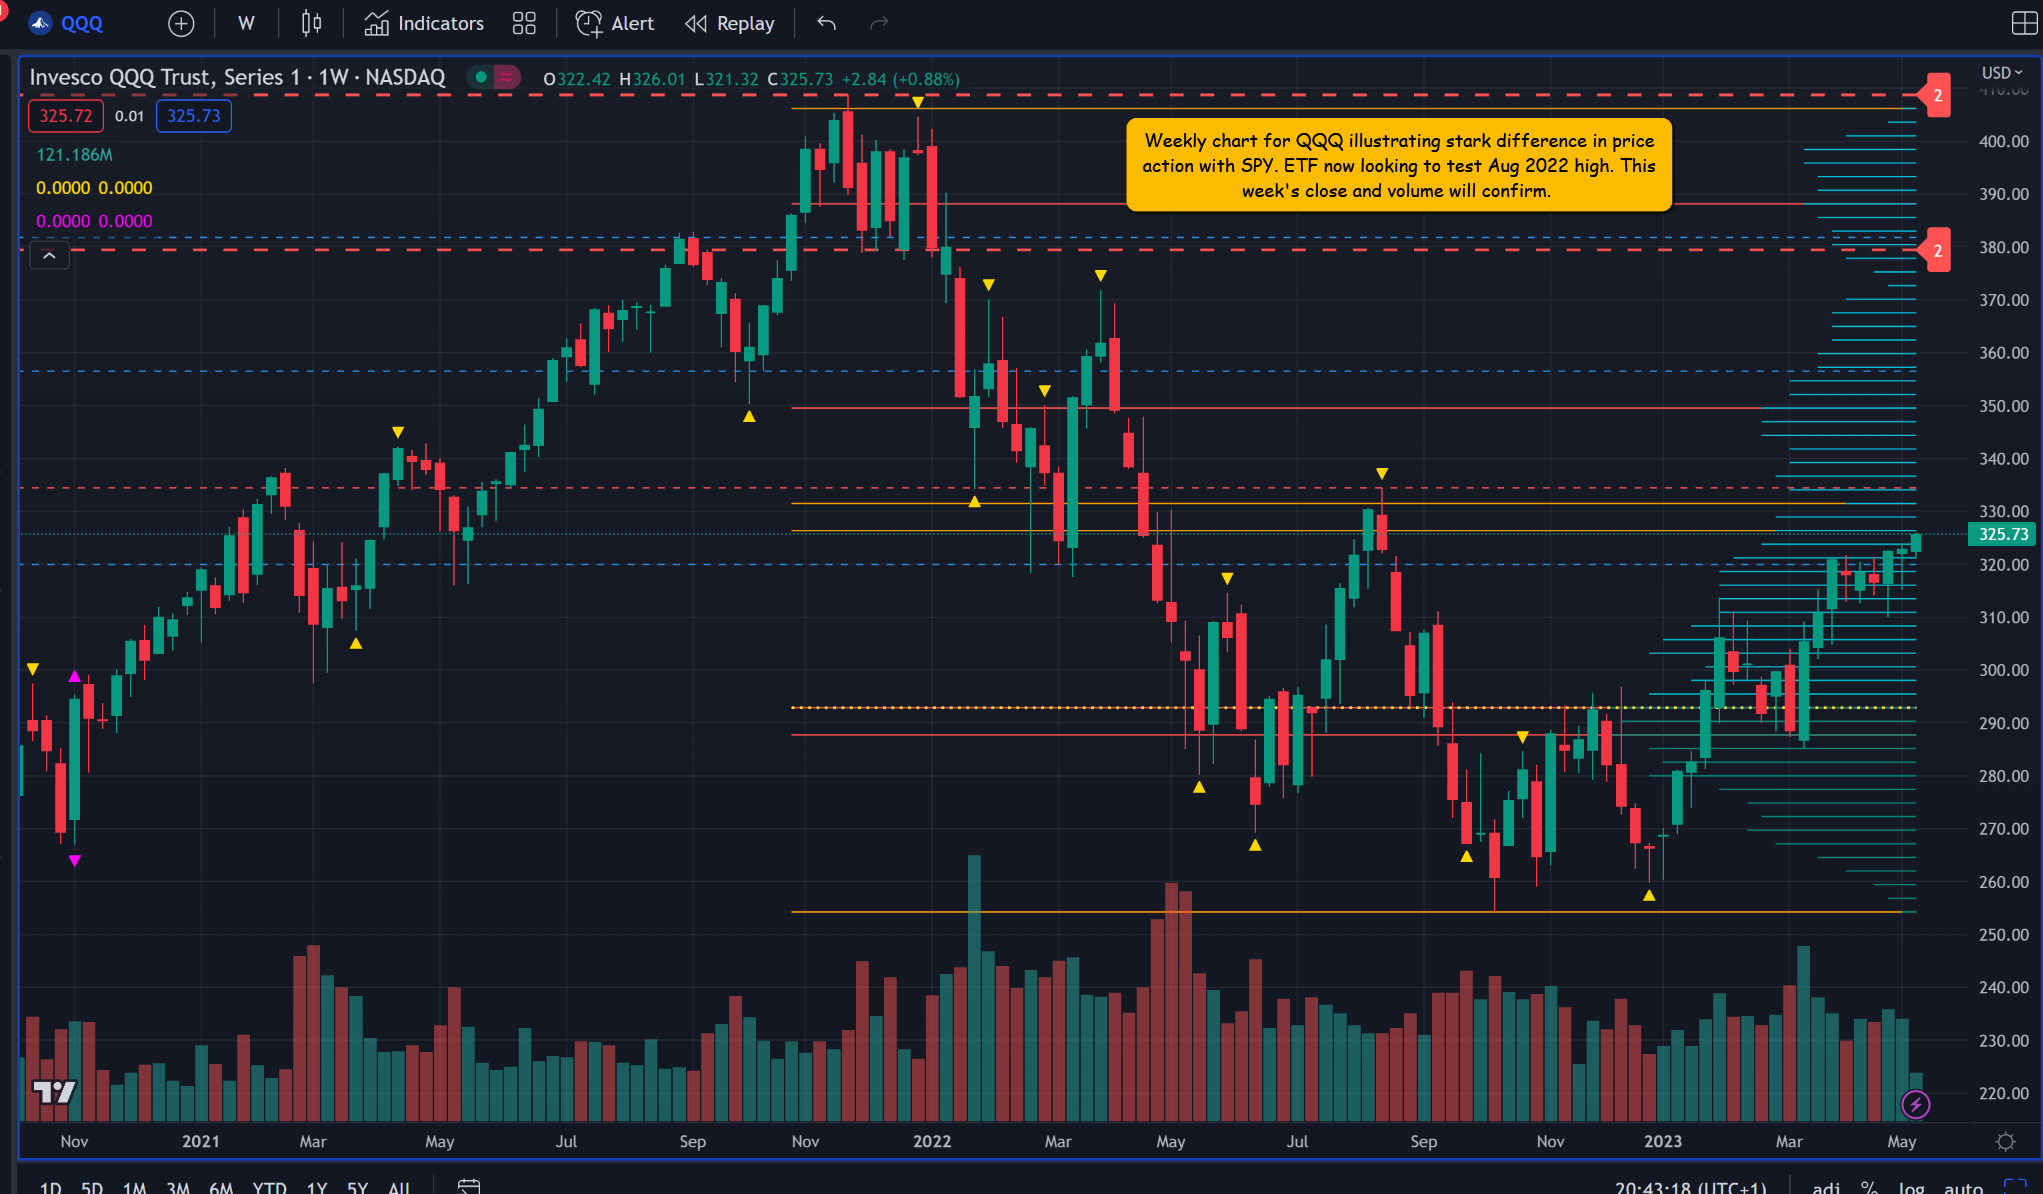
This year’s resurgence in the tech sector will certainly have helped the QQQ and resulted in the ETF outperforming the SPY by some margin YTD returning 20.98% to SPY’s 7.86% (as of 10th May). However, what we can say about resistance levels is that once breached on good volume, they become strong support levels and a springboard for a move higher. For the SPY, this means a re-test of the August 2022 high of 431.73. And as I’ve said many times, even if you only trade the faster charts, levels on the slower time frames will always have a big impact, particularly as the price action approaches. It also pays to check out the S&R levels on the hourly, 4-hour, and daily charts for any confluence across the time frames.
(Click on image to enlarge)
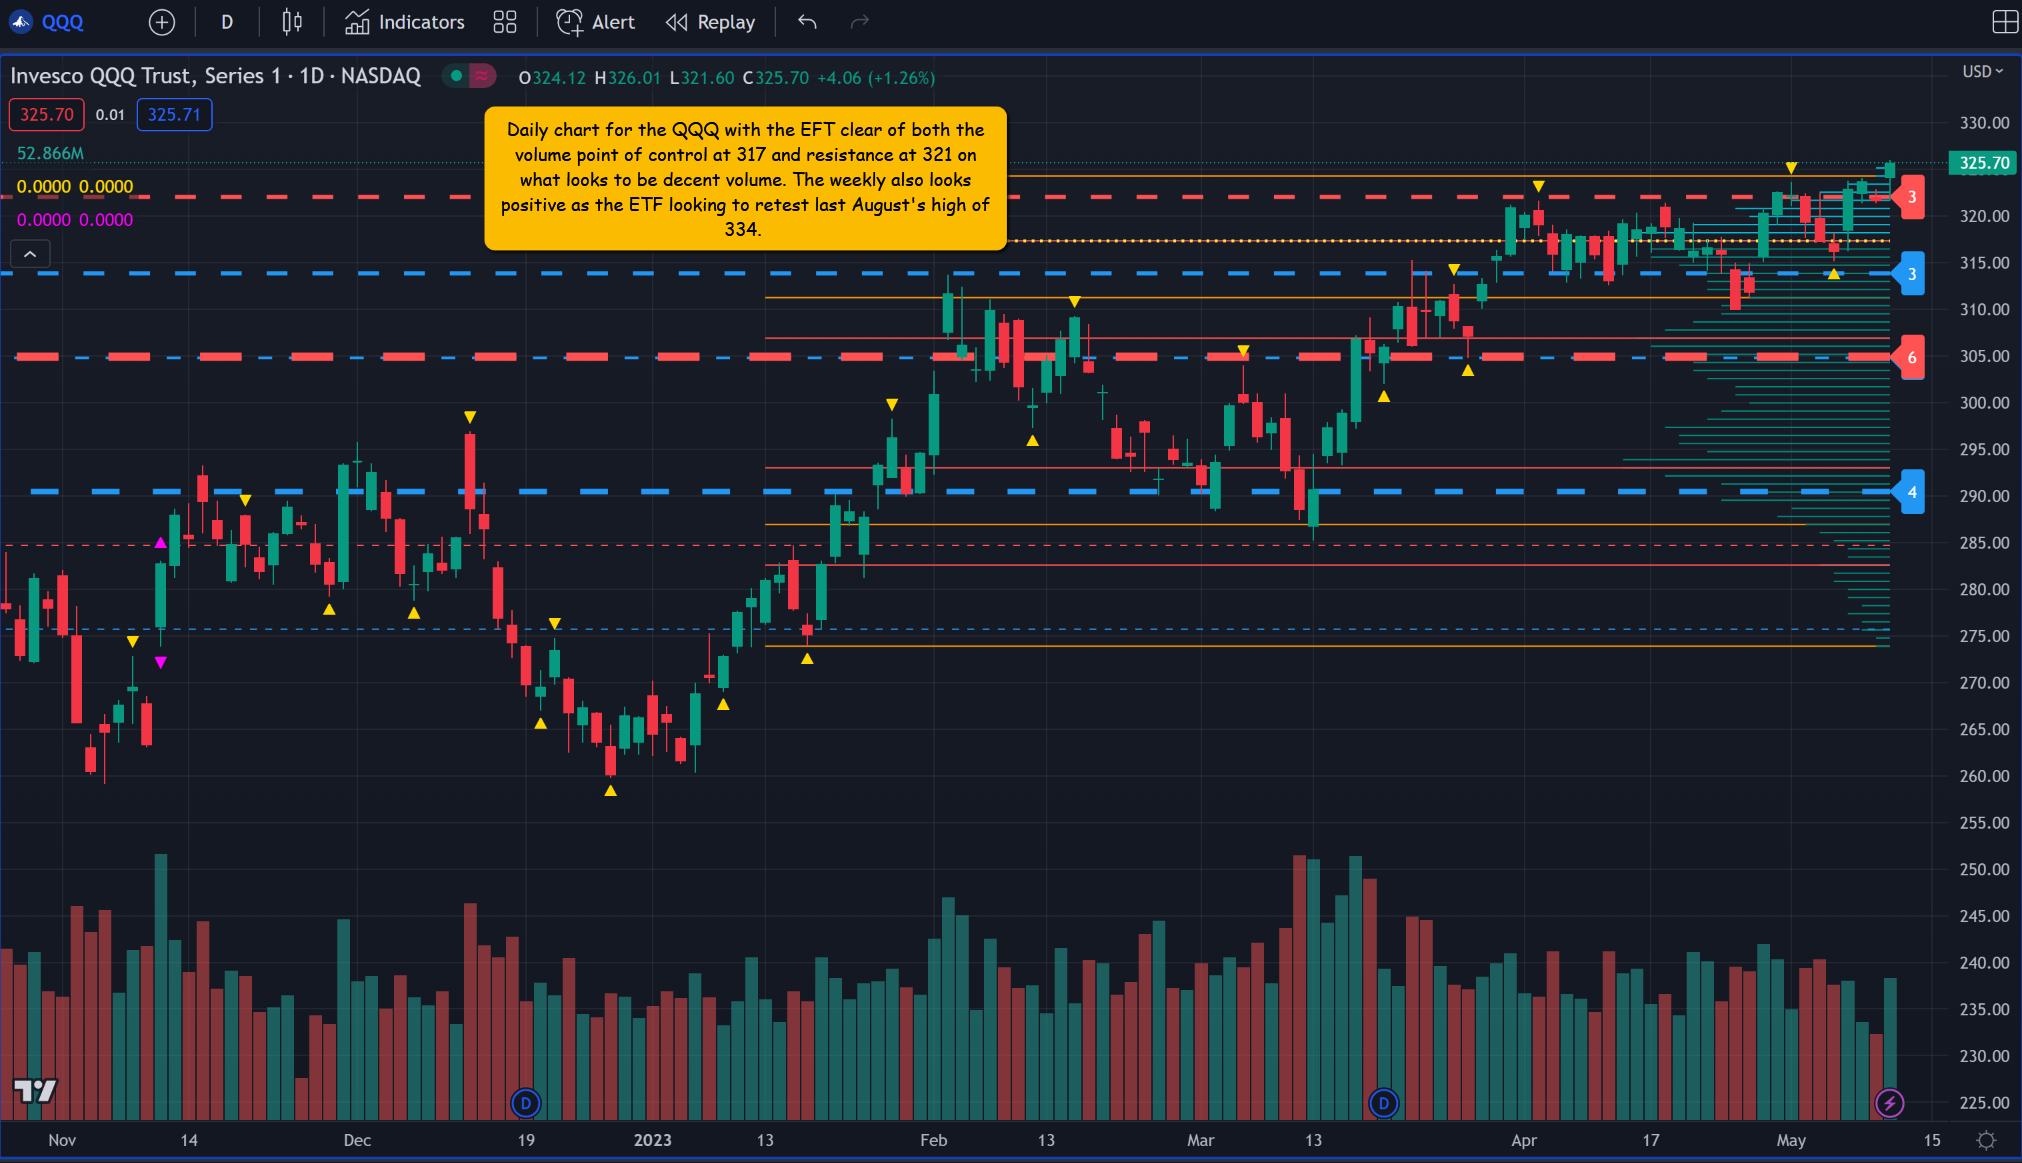
Staying with the QQQ, the daily chart for the ETF looks very positive as the price action is clear of both the volume point of control and the 321 resistance.
(Click on image to enlarge)
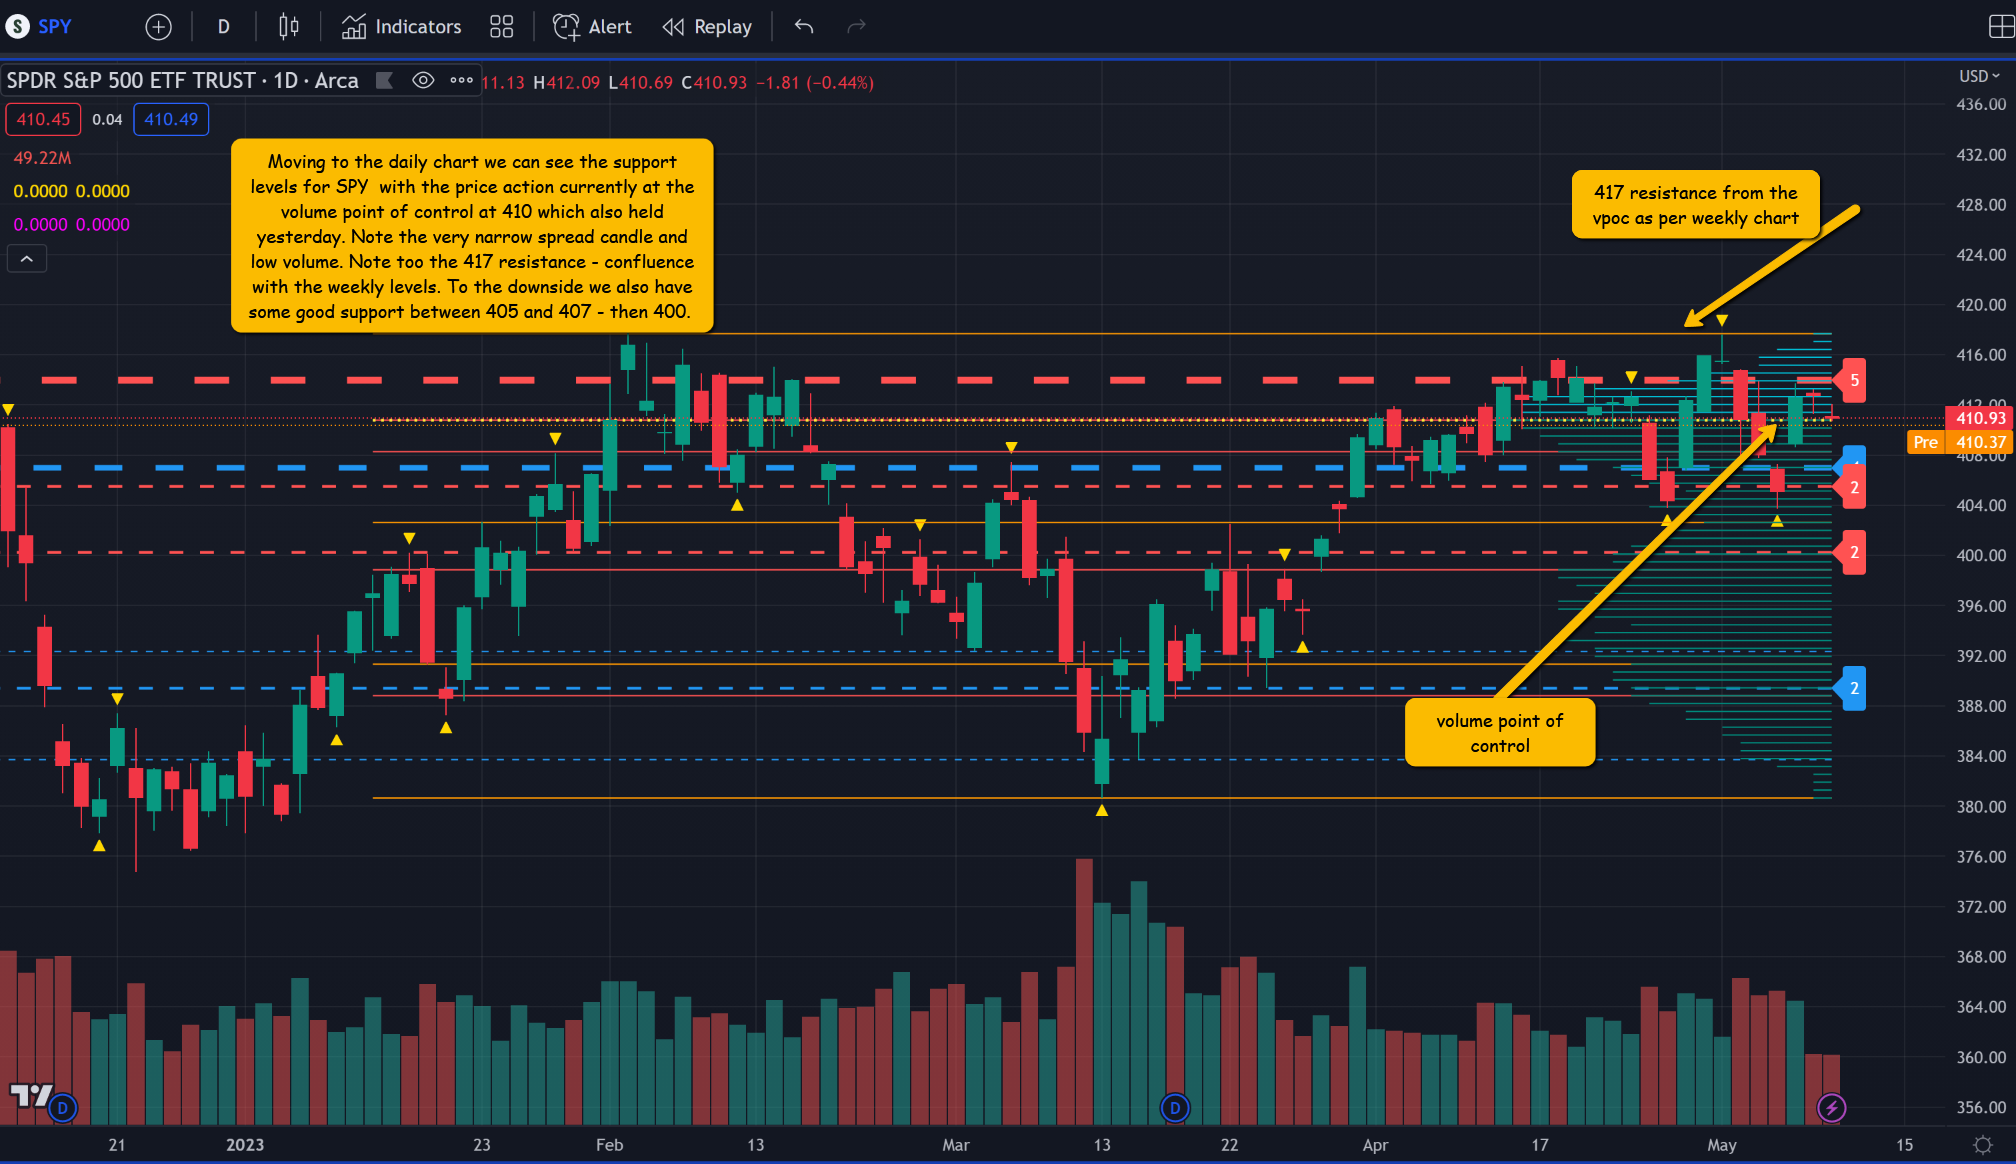
Meanwhile, the SPY is still trying to break away from its vpoc with the price action, so far, failing to break resistance at 414.
More By This Author:
Waiting For Tech
Volume Price Analysis For Meta (Facebook)
Intel Volume Support Must Hold

Comments
Log in or sign up to join the conversation.