
VanEck Gold Miners ETF Elliott Wave Technical Analysis
VanEck Gold Miners ETF – GDX Elliott Wave Analysis
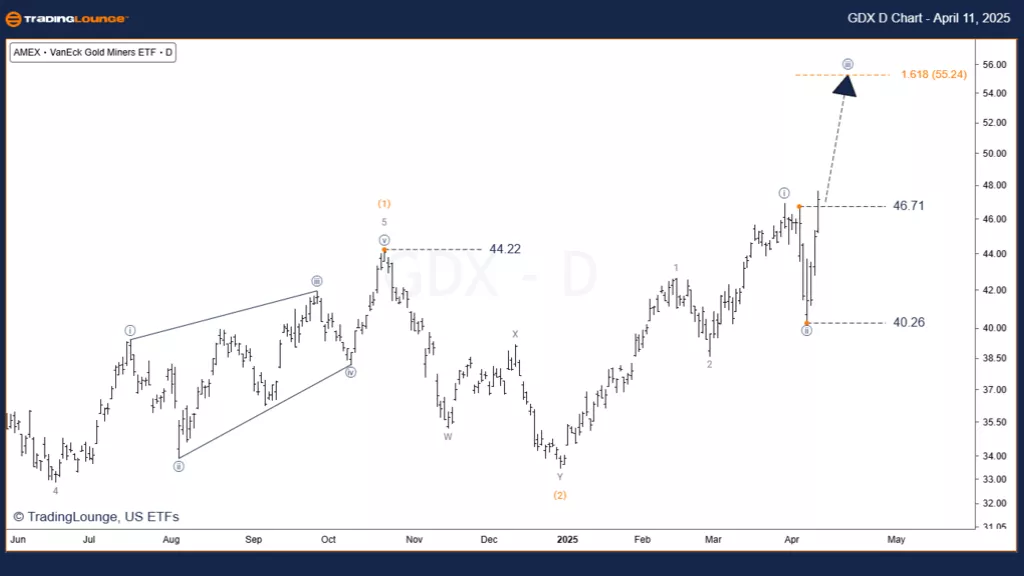
GDX (1D) – Daily Chart Analysis
Function: Major Trend
Mode: Motive
Structure: Impulse
Position: Wave [iii] (navy)
Direction: Rally
Details:
GDX has entered the strongest phase of an impulse wave — the third of a third of a third, known for rapid price movement.
The target price for wave [iii] is $55.24.
$42.00 is the key support level.
Invalidation level: $40.26 — any drop below this would nullify the current wave count.
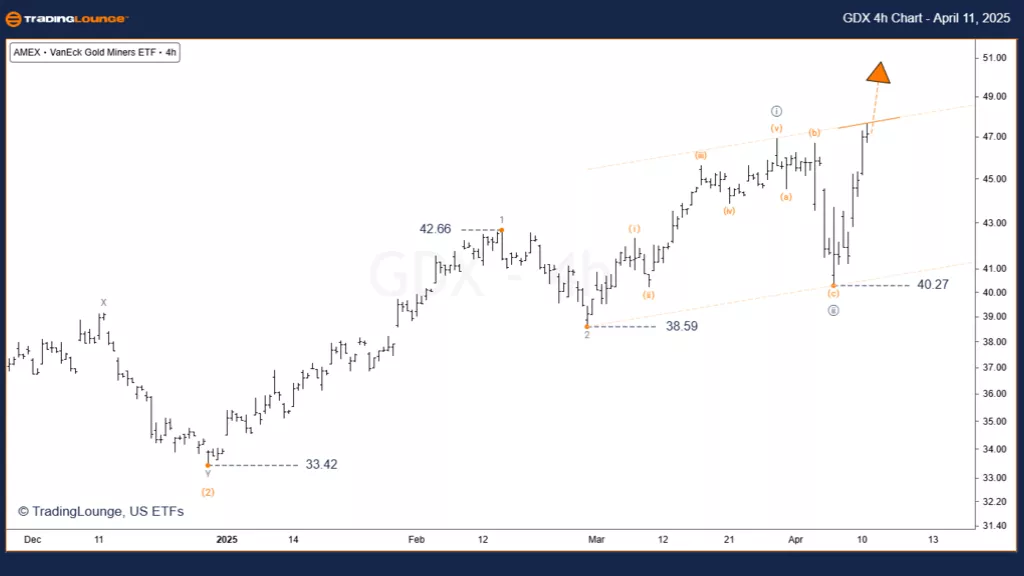
GDX (4H) – 4-Hour Chart Analysis
Function: Major Trend (Minor degree, grey)
Mode: Motive
Structure: Impulse
Position: Wave [iii]
Direction: Rally
Details:
Wave [iii] has confirmed its presence by breaking above $46.71, a significant bullish signal.
To fully validate this wave, watch for a break above the upper boundary of the KCT Base Channel.
Wave [iii] projection: expected to extend 1.618 times wave [i], targeting $55.24.
The invalidation level remains at $40.26.
Conclusion & Strategy
GDX is in the early stages of a bullish impulse, with the most powerful wave segment currently in play.
The rally remains intact, and momentum is building toward the projected $55.24 level.
Traders should track wave development closely and respect the invalidation point ($40.26) to manage risk.
The structure aligns strongly with classic Elliott Wave rules, indicating a high-confidence trade setup.
TradingLounge | Analyst: Siinom
More By This Author:
Elliott Wave Technical Forecast: Suncorp Group Limited
Elliott Wave Technical Analysis: Berkshire Hathaway Inc. - Friday, April 11
Elliott Wave Technical Analysis: Australian Dollar/U.S. Dollar - Friday, April 11
At TradingLounge™, we provide actionable Elliott Wave analysis across over 200 markets. Access live chat rooms, advanced AI & algorithmic charting tools, and curated trade ...
more

