
Elliott Wave Technical Analysis: Australian Dollar/U.S. Dollar - Friday, April 11
AUDUSD Elliott Wave Analysis – Trading Lounge
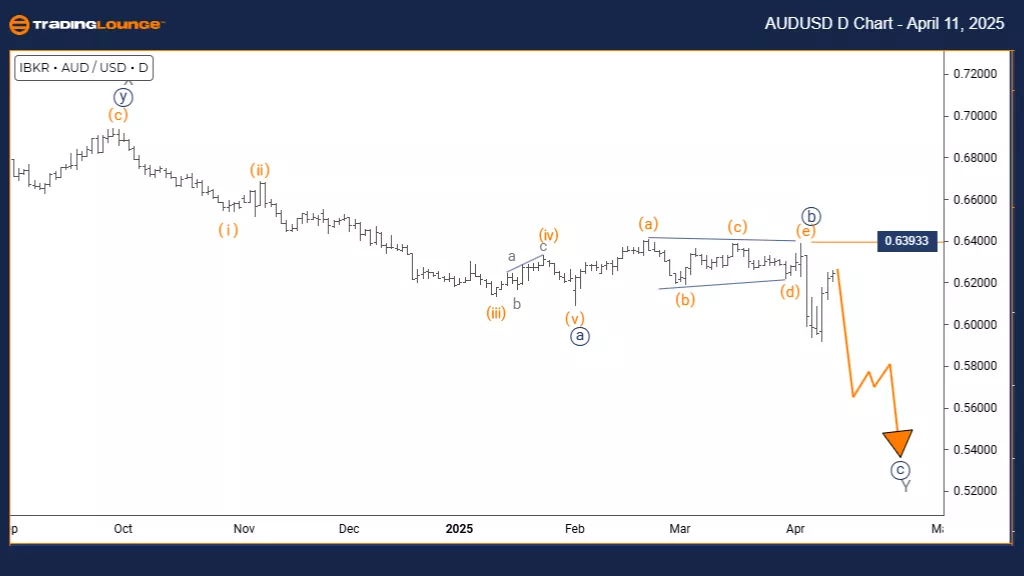
Australian Dollar/U.S. Dollar (AUDUSD) – Daily Chart
AUDUSD Elliott Wave Technical Analysis
Function: Counter Trend
Mode: Impulsive
Structure: Navy blue wave C
Position: Gray wave Y
Direction (Next Lower Degrees): Navy blue wave C (ongoing)
Details: Navy blue wave B appears to be complete, initiating the active navy blue wave C.
Invalidation Level: 0.63933
The daily AUD/USD chart, analyzed through Elliott Wave theory, currently reflects a counter-trend scenario in an impulsive phase, indicating a strong move in one direction. The structure belongs to navy blue wave C, part of a broader gray wave Y corrective pattern.
The previous navy blue wave B seems to have concluded. Market movement now develops through wave C, which is expected to continue advancing in its current direction. Watch closely for signals confirming this wave's progression, as impulsive phases tend to carry notable strength.
A critical risk level is at 0.63933. If the price drops below this, the current wave interpretation would be invalid and the structure must be reassessed.
This technical formation suggests that wave C's impulsive move is underway and likely to proceed following the end of wave B. Traders should monitor market action for ongoing momentum while keeping the invalidation level in mind for risk controls.
The Elliott Wave structure offers a framework for interpreting price trends, helping traders align their strategies. Key observations include wave progress and pattern conformity. Attention should stay on confirming the impulsive behavior of wave C within the corrective sequence.
Validating this setup is essential to adjusting trading decisions and anticipating price moves.
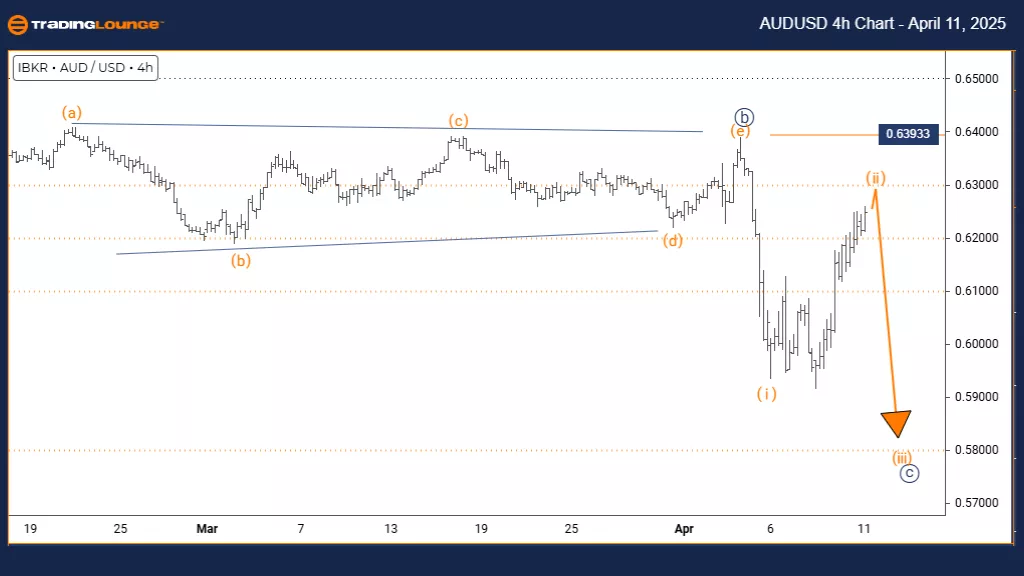
Australian Dollar/U.S. Dollar (AUDUSD) – 4-Hour Chart
AUDUSD Elliott Wave Technical Analysis
Function: Counter Trend
Mode: Corrective
Structure: Orange wave 2
Position: Navy blue wave C
Direction (Next Lower Degrees): Orange wave 3
Details: Orange wave 1 seems completed; orange wave 2 is currently unfolding.
Invalidation Level: 0.63933
The 4-hour AUD/USD chart, analyzed through Elliott Wave theory, points to a counter-trend corrective phase. The structure under observation is orange wave 2, which falls within a larger correction labeled navy blue wave C—the final segment in a three-part wave sequence.
The earlier orange wave 1 looks completed, and the price action is now progressing within orange wave 2. The next expected phase is orange wave 3, anticipated to follow the main trend with stronger momentum.
A critical price level to monitor is 0.63933. If the price breaks below this point, the existing wave count becomes invalid, requiring a fresh analysis.
This setup suggests a likely bearish continuation once orange wave 2 finishes. Traders should watch closely for signs that the correction has ended, as wave 3 movements are typically forceful and align with the dominant trend.
Elliott Wave theory helps traders project possible price directions, making it easier to align strategies. Tracking wave developments and key levels is essential to validate the forecasted trend. The primary focus is confirming the shift from corrective wave 2 to impulsive wave 3, which may signal increased bearish movement.
Technical Analyst: Malik Awais
More By This Author:
Elliott Wave Technical Analysis: Cardano Crypto Price News For Friday, April 11
Elliott Wave Analysis: Block, Inc.
Elliott Wave Technical Analysis: CAC 40 - Thursday, April 10
At TradingLounge™, we provide actionable Elliott Wave analysis across over 200 markets. Access live chat rooms, advanced AI & algorithmic charting tools, and curated trade ...
more

