
VanEck Gold Miners ETF – GDX Elliott Wave Technical Analysis
VanEck Gold Miners ETF – GDX (1M) Elliott Wave Technical Analysis
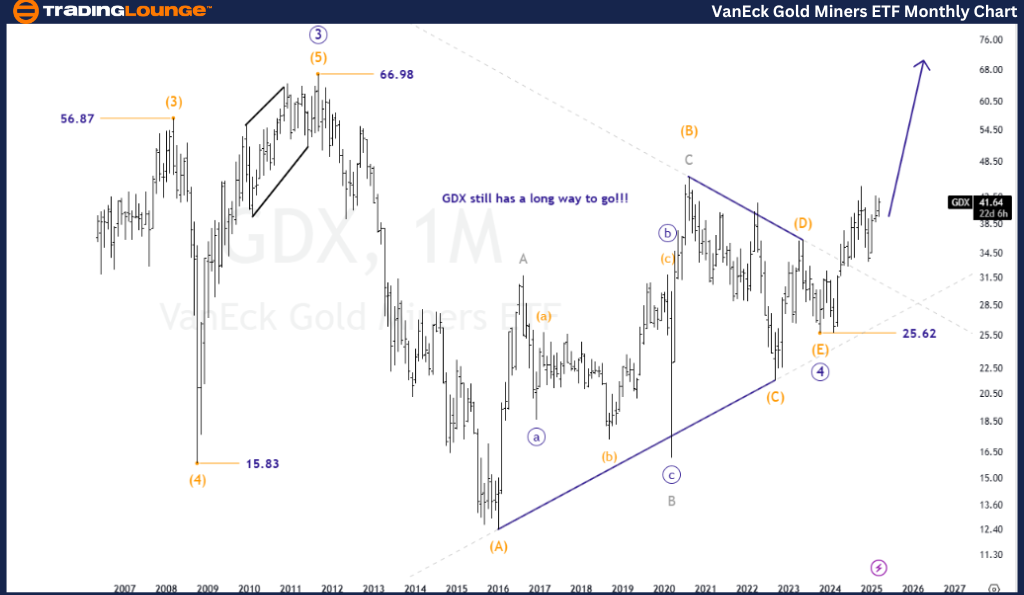
Monthly Chart
- Function: Major Trend (Primary Degree – Navy)
- Mode: Motive
- Structure: Post-Triangle Thrust
- Position: Wave (3) of [5]
- Direction: Upside Rally
Details:
- The bullish trend continues as GDX has broken out of a long-term triangle wave [4].
- New all-time highs are expected since the trend is still in its early phase.
- With wave 2 potentially completed, a strong rally is anticipated in the coming weeks or months.
- Invalidation Level: $25.62
VanEck Gold Miners ETF – GDX (1W) Elliott Wave Technical Analysis
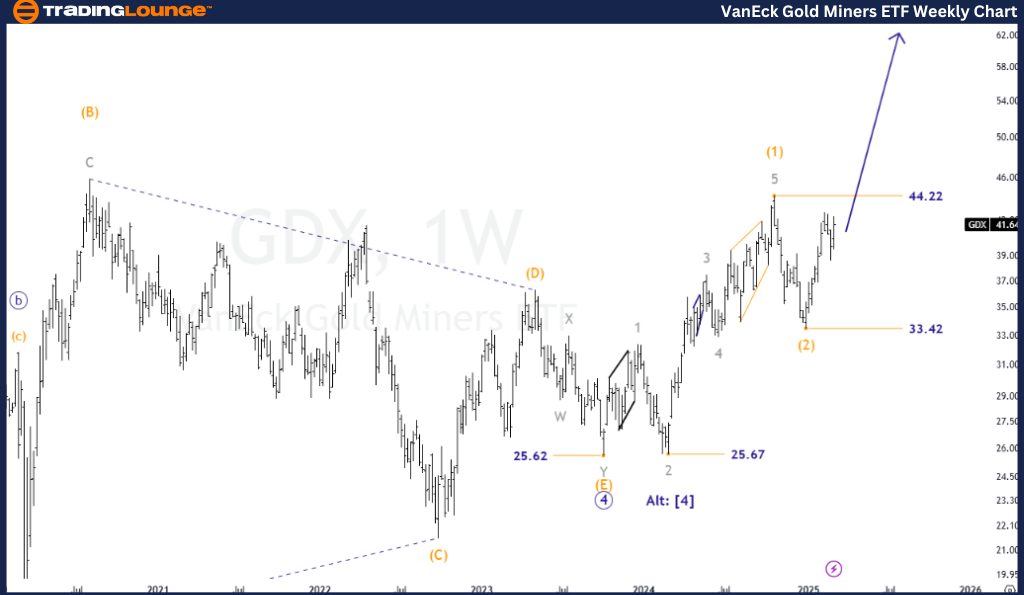
Weekly Chart
- Function: Major Trend (Primary Degree – Navy)
- Mode: Motive
- Structure: Impulse Wave
- Position: Wave 3 of (3)
- Direction: Uptrend
Details:
- If wave (2) correction is over, GDX should rally to higher prices to complete the five-wave upward movement.
- The recent low now serves as critical support, indicating the completion of wave (2).
- The market must break above $44.22 to confirm the uptrend.
- Invalidation Level: $33.42
Conclusion
The summary of the Elliott Wave analyses above highlights:
- GDX ETF is exhibiting strong impulsive waves, signaling long-term rally potential.
- This presents a trading opportunity to ride a wave that could surpass the current all-time high in GDX.
- Following Elliott Wave rules and monitoring invalidation levels is crucial to minimize potential losses.
Technical Analyst: Siinom
More By This Author:
Elliott Wave Trading Strategies: Mastering SP500, Nasdaq & Bitcoin Market Waves
Unlocking ASX Trading Success: James Hardie Industries
Elliott Wave Technical Analysis: McDonald's Corp. - Friday, March 7
At TradingLounge™, we provide actionable Elliott Wave analysis across over 200 markets. Access live chat rooms, advanced AI & algorithmic charting tools, and curated trade ...
more
How did you like this article? Let us know so we can better customize your reading experience.

Comments
Leave a comment to automatically be entered into
our contest to win a free Echo Show.

