
Elliott Wave Technical Analysis: McDonald's Corp. - Friday, March 7
McDonald’s Corp. (MCD) Elliott Wave Analysis – Trading Lounge Daily Chart
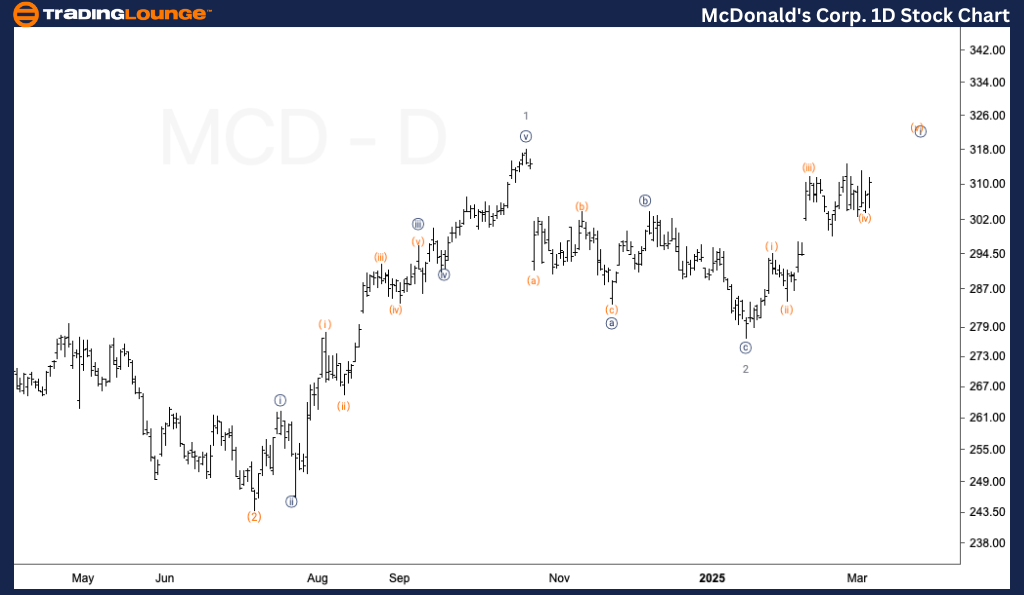
MCD Elliott Wave Technical Analysis – Daily Chart
- Function: Trend
- Mode: Impulsive
- Structure: Motive
- Position: Wave 3 of (3)
- Direction: Upside within Wave 3
Details:
The long-term outlook for McDonald's (MCD) remains bullish, with further confirmation expected once the stock consistently trades above $300. A pullback in Wave {ii} of 3 is anticipated near the previous all-time high (ATH), which could present a buying opportunity before the next move higher.
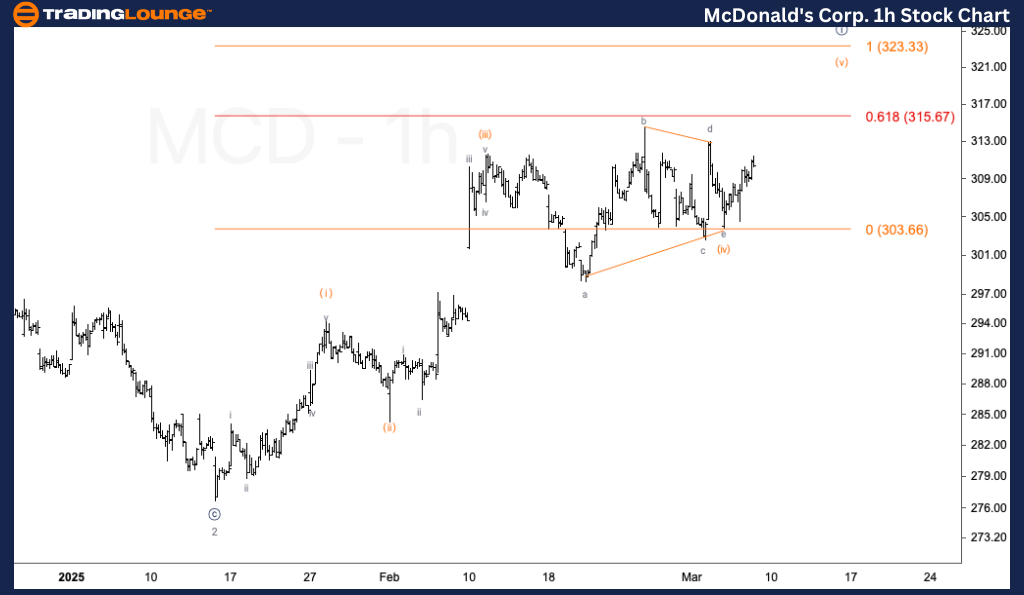
MCD Elliott Wave Technical Analysis – 1H Chart
- Function: Trend
- Mode: Impulsive
- Structure: Motive
- Position: Wave (v) of {i}
- Direction: Upside within Wave (v)
Details:
The 1-hour chart suggests that Wave (iv) is a triangle correction, with a potential bottom already in place. If this structure holds, further upside is expected within Wave (v).
- The target for Wave (v) is around $323, which aligns with Wave (v) equaling Wave (i).
- This level could mark the completion of Wave {i}, followed by a minor corrective pullback.
Technical Analyst: Alessio Barretta
More By This Author:
Unlocking ASX Trading Success: James Hardie Industries
Elliott Wave Technical Analysis: British Pound/Australian Dollar - Friday, March 7
Elliott Wave Technical Analysis: Bitcoin Crypto Price - Friday, March 7
At TradingLounge™, we provide actionable Elliott Wave analysis across over 200 markets. Access live chat rooms, advanced AI & algorithmic charting tools, and curated trade ...
more

