
U.S. ETF : VanEck Semiconductor ETF
SMH Elliott Wave Analysis Trading Lounge
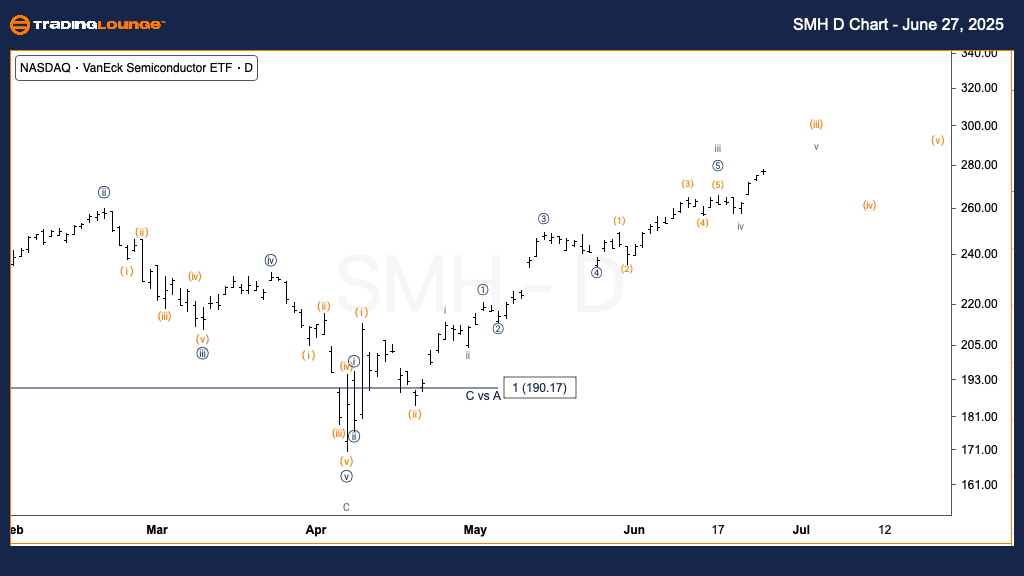
VanEck Semiconductor ETF (SMH) Daily Chart
SMH Elliott Wave Technical Analysis
FUNCTION: Trend
MODE: Motive
STRUCTURE: Impulsive
POSITION: Wave (iii) of {iii}
DIRECTION: Upside in wave (iii)
DETAILS: Wave v of (iii) is unfolding. We're nearing TradingLevel3 at $300. The speed and angle of this rally support the idea that SMH is in the third wave of a third wave, typically the most aggressive phase in a bullish trend.
VanEck Semiconductor ETF (SMH) 1H Chart
SMH Elliott Wave Technical Analysis
FUNCTION: Trend
MODE: Motive
STRUCTURE: Impulsive
POSITION: Wave v of (iii)
DIRECTION: Top in wave v
DETAILS: SMH is targeting the end of wave v. The first wave v target is $282, aligned with a 0.618 Fibonacci extension relative to wave i. This is a typical projection and may mark a short-term high before entering wave (iv) correction.
This analysis highlights the current market structure of the VanEck Semiconductor ETF (SMH) using Elliott Wave Theory. Both daily and hourly timeframes suggest bullish momentum with specific wave levels offering insight into upcoming market behavior.
Daily Chart Summary:
SMH remains strong within wave (iii) of {iii}, often the most powerful stage in an Elliott wave. As the price nears the $300 mark, bullish signals remain intact.
1H Chart Summary:
SMH is likely reaching the top of wave v of (iii), with $282 as an immediate upside target. This may lead into a brief corrective wave (iv) before another advance.
Technical Analyst: Alessio Barretta
More By This Author:
Elliott Wave Technical Forecast: Newmont Corporation - Friday, June 27
Elliott Wave Technical Analysis: U.S. Dollar/Japanese Yen - Friday, June 27
Indian Stocks: NTPC Limited
At TradingLounge™, we provide actionable Elliott Wave analysis across over 200 markets. Access live chat rooms, advanced AI & algorithmic charting tools, and curated trade ...
more

