
Time To Look At Fixed Income And Inflation Protection
Recently, I was asked on CNBC Asia what I thought about fixed income at the present time.
My answer was that I thought having cash allocated to some is wise and that we were doing that as well.
Last year, I had the pleasure of meeting Nancy Davis from Quadratic Capital.
Their product IVOL ETF is “designed to hedge the risk of an increase in fixed income volatility and/or an increase in inflation expectations."
It also seeks to profit from a steepening of the yield curve, whether that occurs via rising long-term interest rates or falling short term interest rates, which are historically associated with large equity market declines.”
My past Daily’s have covered the risk to the equites market and the potential for higher inflation or at the very least, stagflation.
I have also talked about “normalization” where Fed Funds rates and the rate of inflation are in alignment.
IVOL is an instrument meant to benefit from that normalization while at the same time offering some protection against inflation.
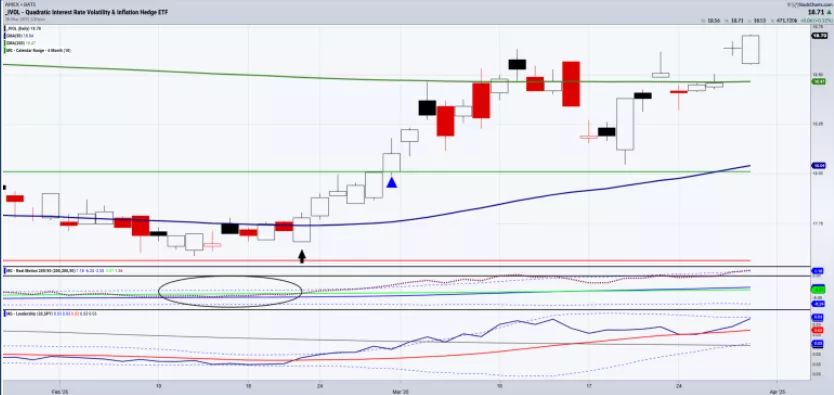
The chart is interesting and of course, the timeframes differ.
On the daily chart, a few standouts
- The new high close since October 2024.
- The outperformance to the benchmark.
- The accumulation phase with IVOL over the 200-DMA.
- The circle I drew on real motion shows the bullish divergence in momentum that happened in February, just as the price started to clear the 50-DMA.
No doubt the daily chart makes a bullish case.
Looking at the weekly and monthly charts:
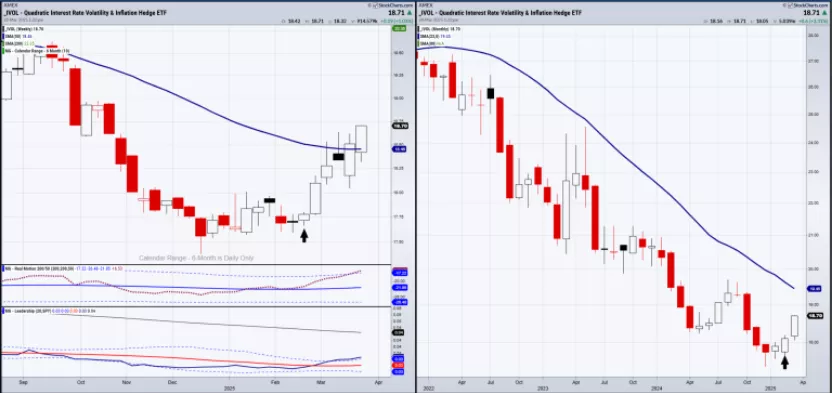
IVOL has cleared the 50-WMA for the second week in a row, thereby confirming the phase change to recuperation.
Last time this instrument traded above the key weekly moving average was in May 2023.
That’s significant.
On the monthly chart, IVOL remains under the 23-month moving average, which we like to use as an indicator for 2-year business cycles.
Therefore, in the short term, IVOL is rallying in response to a stagflationary environment. Basically, with the economy slightly contracting, equities falling and inflation sticky, it’s a good place to be.
Nonetheless, the jury is out on whether this is a more sustaining sea change.
Should IVOL clear that 23-month, we must wonder whether the economy is about to enter a deeper recession, or worse, hyperinflation.
ETF Summary
(Pivotal means short-term bullish above that level and bearish below)
S&P 500 (SPY) Now we watch the lows from early March 549
Russell 2000 (IWM) 200 pivotal
Dow (DIA) First close under the 50-WMA since 2023
Nasdaq (QQQ) 466.43 March low
Regional banks (KRE) 55-60 the trading range to watch
Semiconductors (SMH) 205 monthly support
Transportation (IYT) 63 support to hold
Biotechnology (IBB) 130 support
Retail (XRT) 66.07 March support
More By This Author:
Buy The Dip Or Buy The Consolidation Breakout?
Examining The Transportation Sector
Examining The Retail Sector
Disclaimer: Educational purposes only, not official trading advice.


