
The Bear Case: Bull Flag Failure!
Market Update (Sep 4 2024)
- There was a spike of the supply level in conjunction with a bearish commitment below the bull flag support at 5580.
- This is likely the overdue test of the previous down swing from 17 Jul-5 Aug.
- A complex trading range as discussed in the video is still unfolding.
- During a market pullback is the best time to look for relative strength in the stocks.
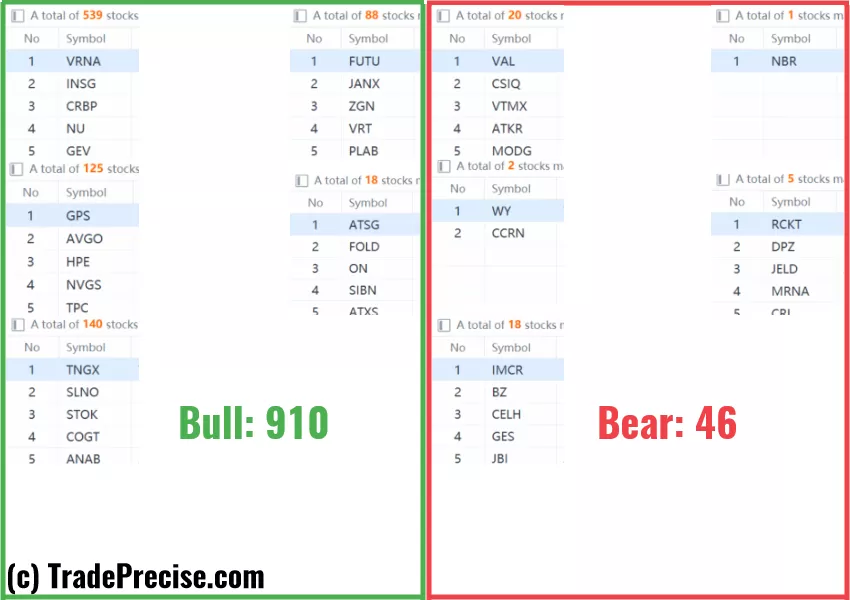
Market Environment
The bullish vs. bearish setup is 910 to 46 from the screenshot of my stock screener below.
3 Stocks Ready To Soar
9 “low-hanging fruits” trade entries setups & 27 actionable setups such as were discussed during the live session before the market open (BMO).
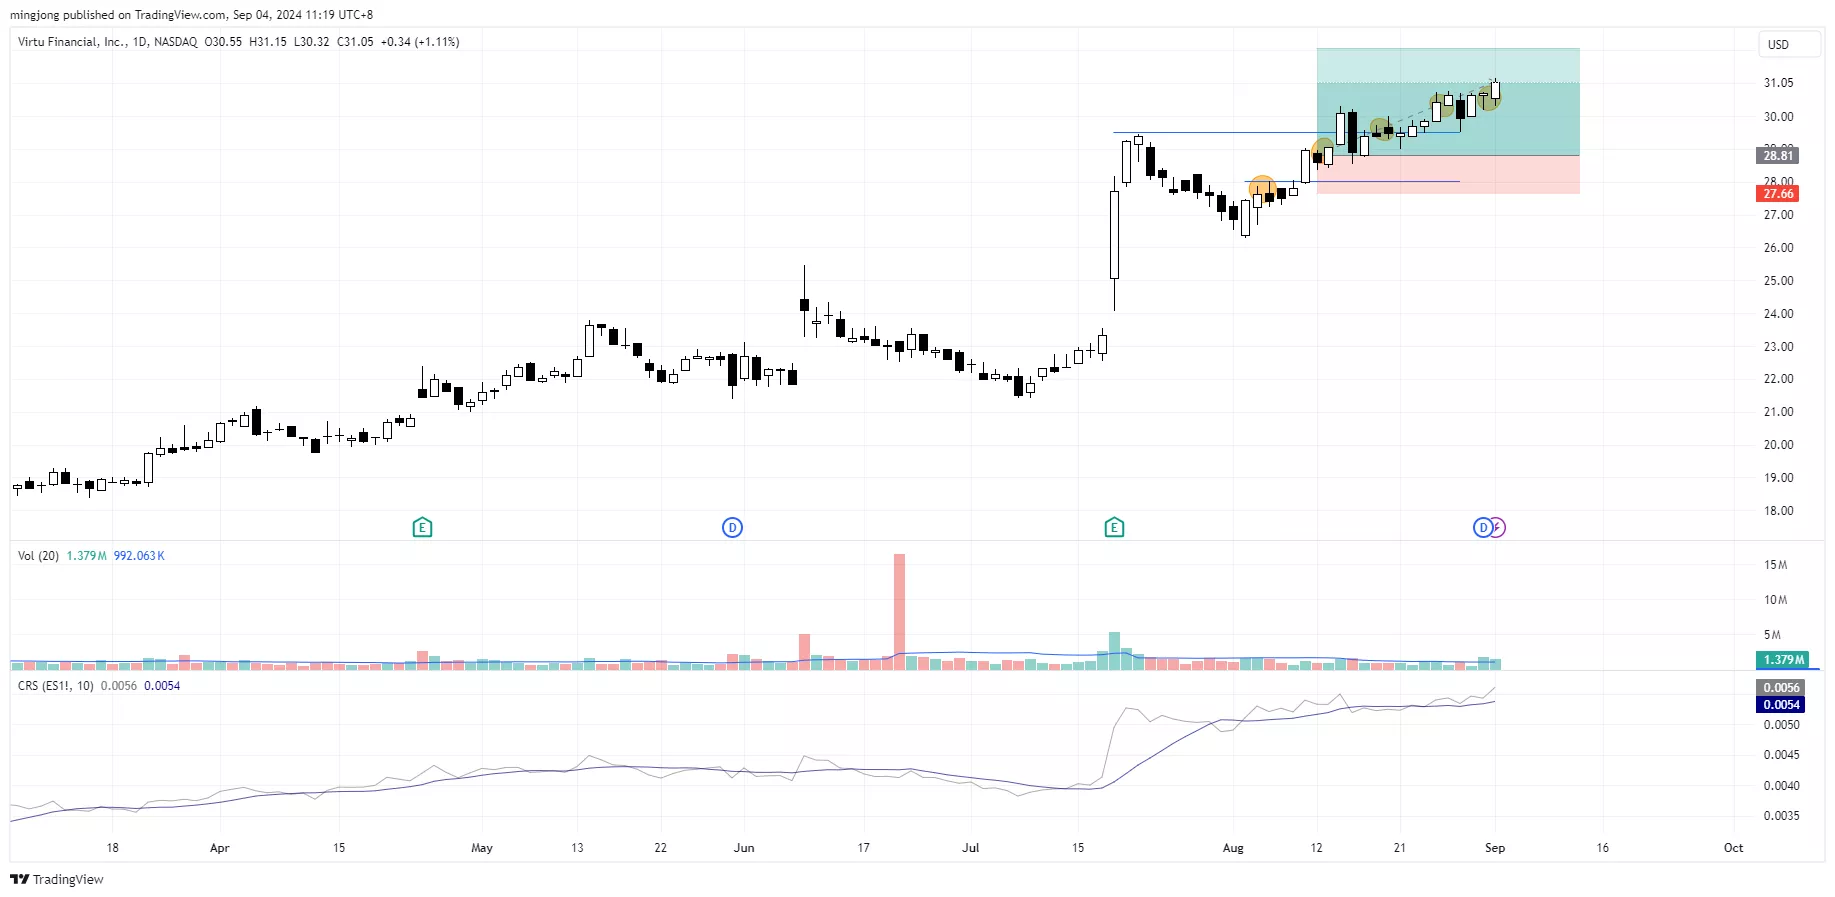
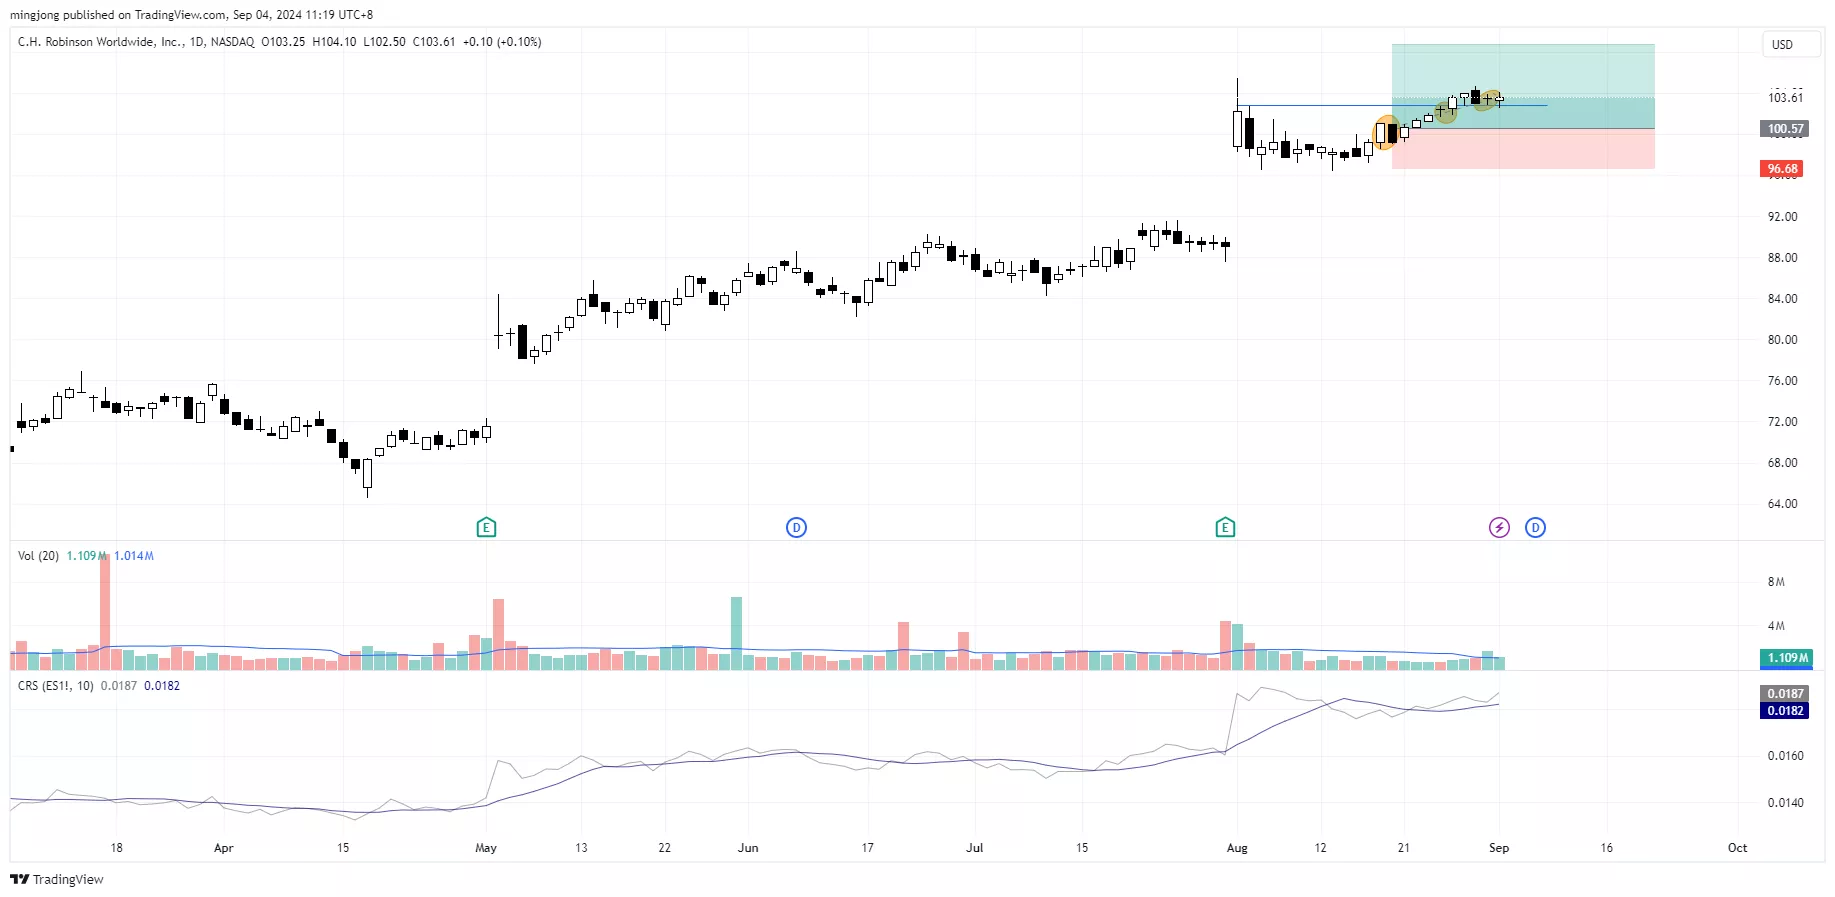
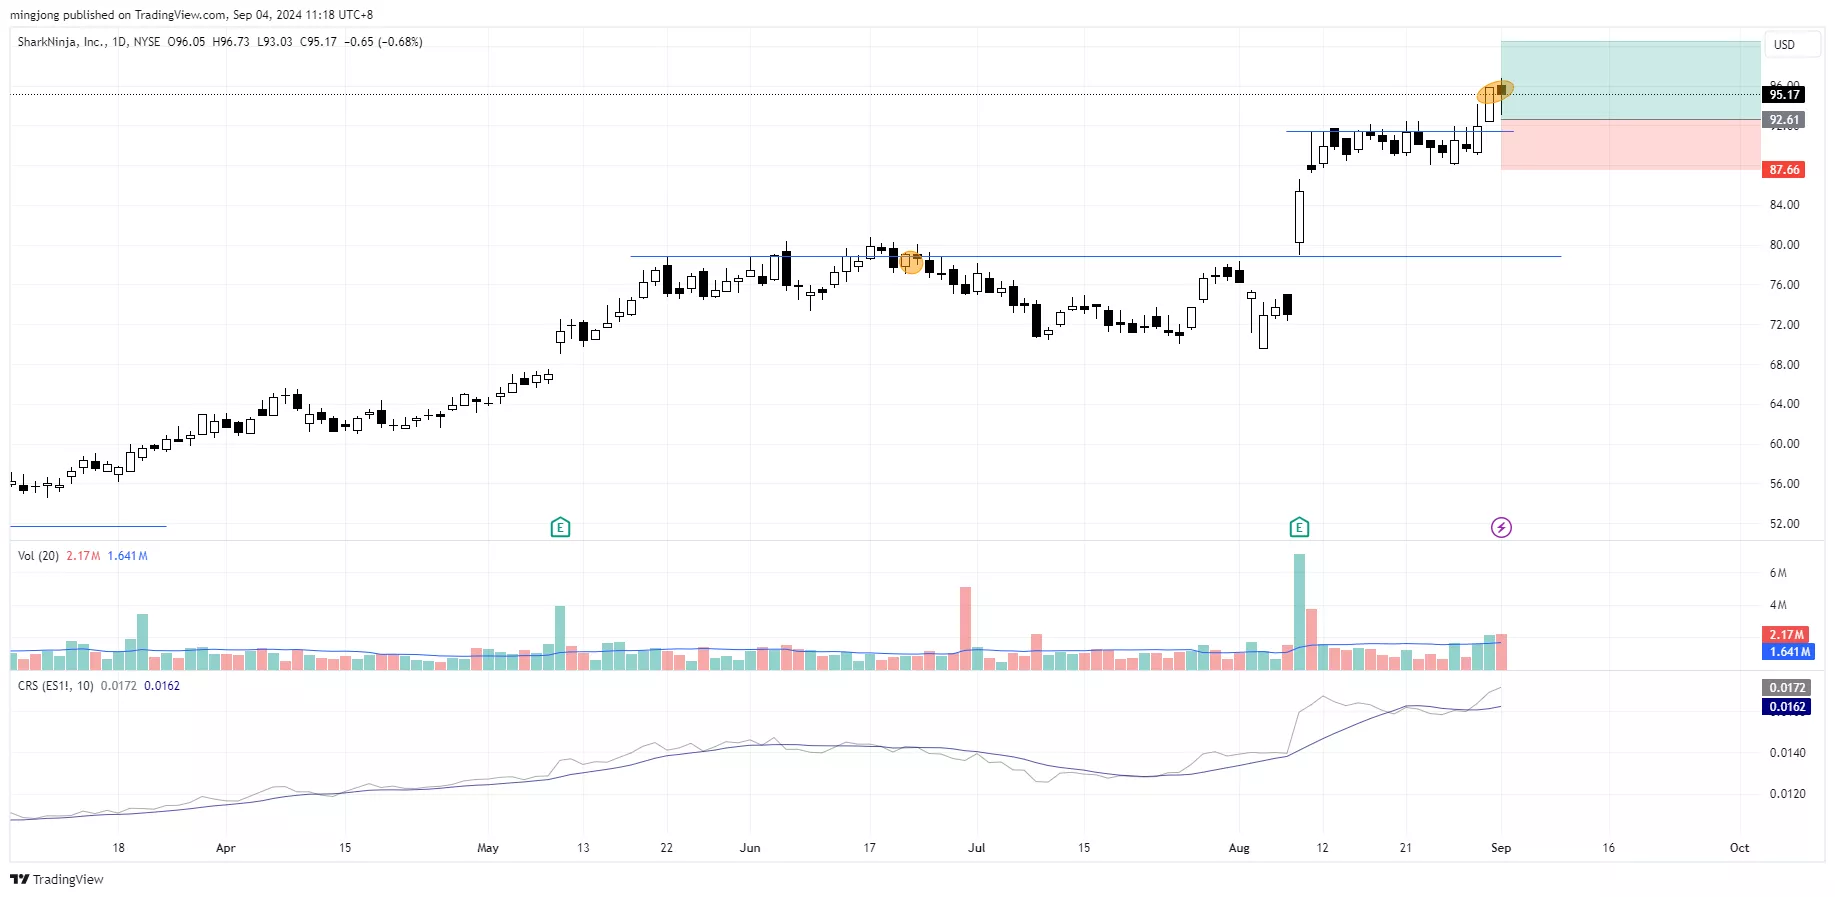
While the market is taking a hit, we will look for those who drop the least or even bucking the trend, such as VIRT, CHRW, SN.
Be patient and wait until the market is ready for a turn or to test the water with smaller position size in the stocks showing outperformance.
Watch the free-preview video from the WLGC session before the market opens on 3 Sep 2024 to find out the following:
- The signal that traders need to seek for to confirm the bullish flag.
- The key support zone that S&P 500 could visit should the failure of the bull flag shows up.
- How to judge the volume level to form a directional bias.
- And a lot more…
More By This Author:
Is The S&P 500 On The Verge Of A Breakout?
Why Low Volume In S&P 500 Could Be Signaling A Hidden Opportunity?
Is The Market Bottom Here? Will The S&P 500 Break Down Further?
Disclaimer: The information in this presentation is solely for educational purpose and should not be taken as investment advice.


