
Watch the video from the WLGC session to find out the following:
-
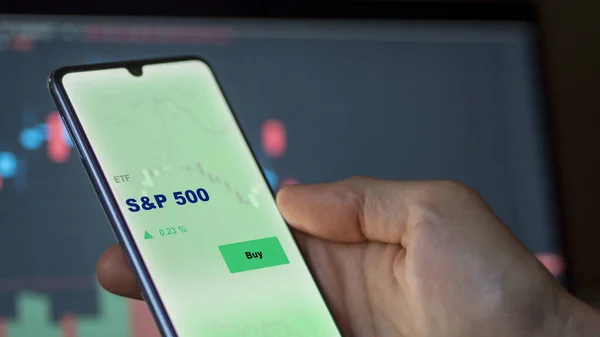
How do we interpret low trading volume in the S&P 500 and its implications for future price movements?
-
how to interpret the market reaction from the Jackson Hole symposium and Fed minutes and what to expect next.
-
The importance of monitoring supply spikes and what the absence of such spikes indicates about the market’s strength.
-
The key level to watch out for a pullback in the S&P 500.
-
And a lot more...
Market Environment
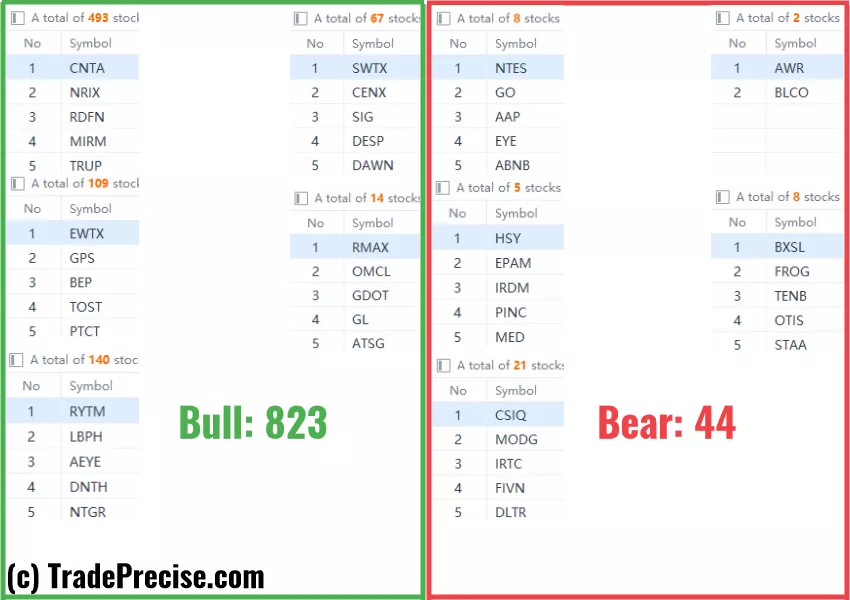
The bullish vs. bearish setup is 823 to 44 from the screenshot of my stock screener below.
The short-term market breadth was hitting the overbought level at 80 suggesting the resuming of the upside momentum. This is confirmed by the follow-through of many setups as discussed last week.
The bear was given opportunities to attack the market last Thursday and Friday but the supply level was mediocre as discussed in the video.
3 Stocks Ready To Soar
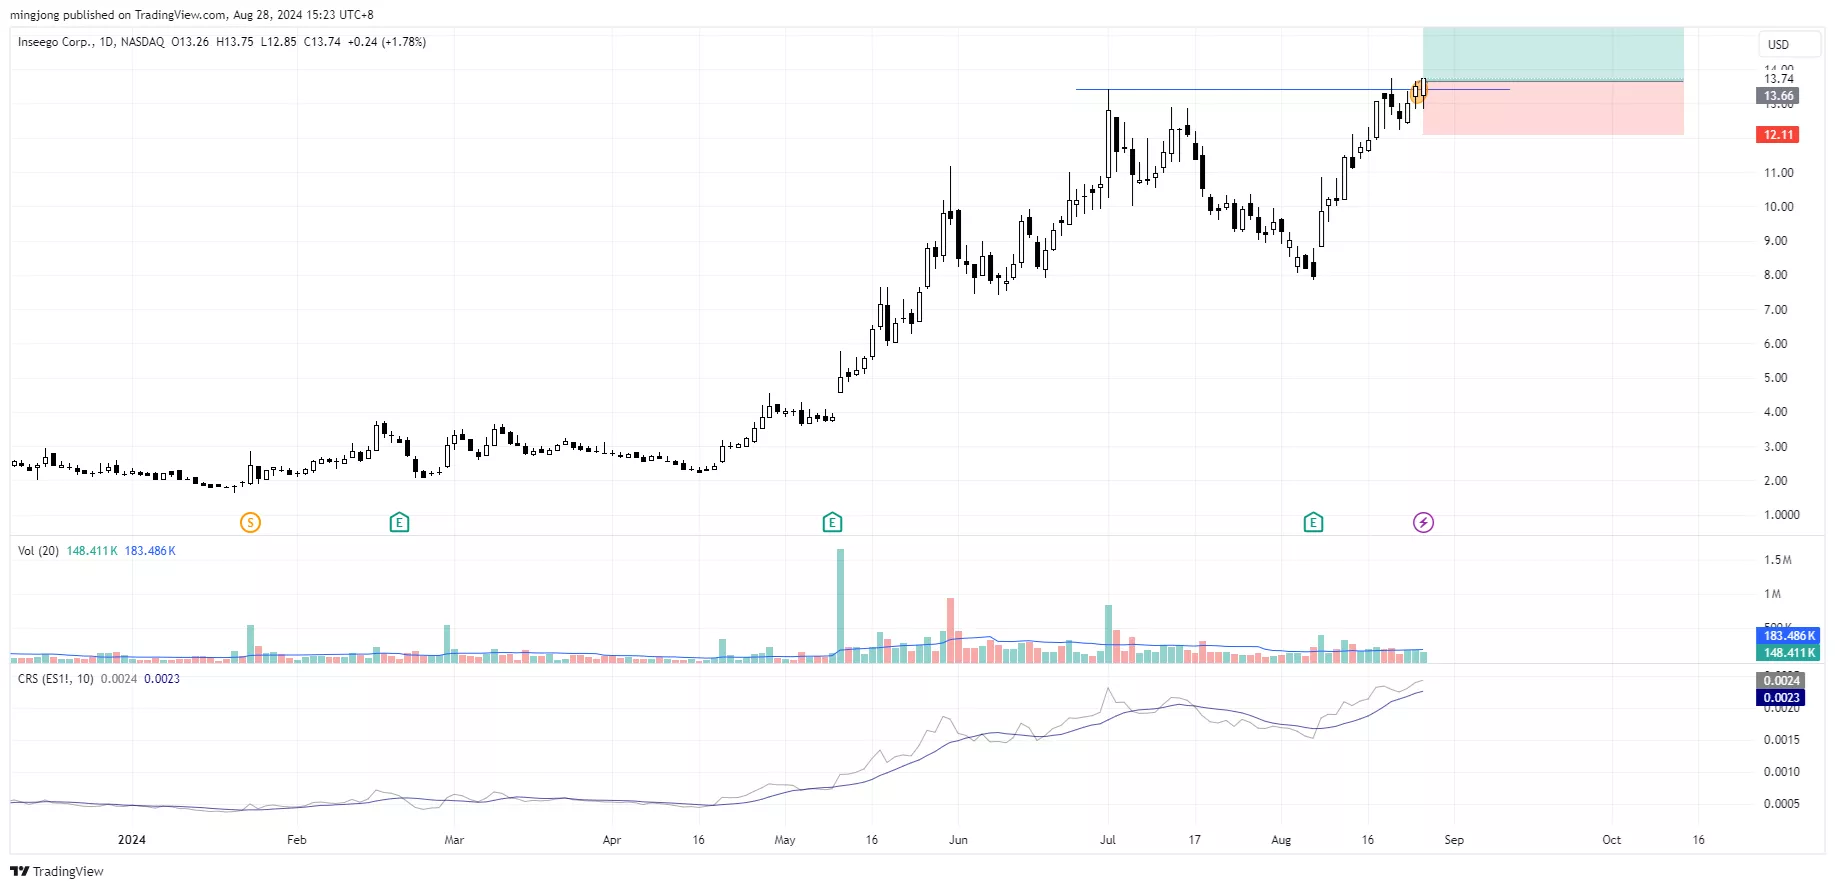
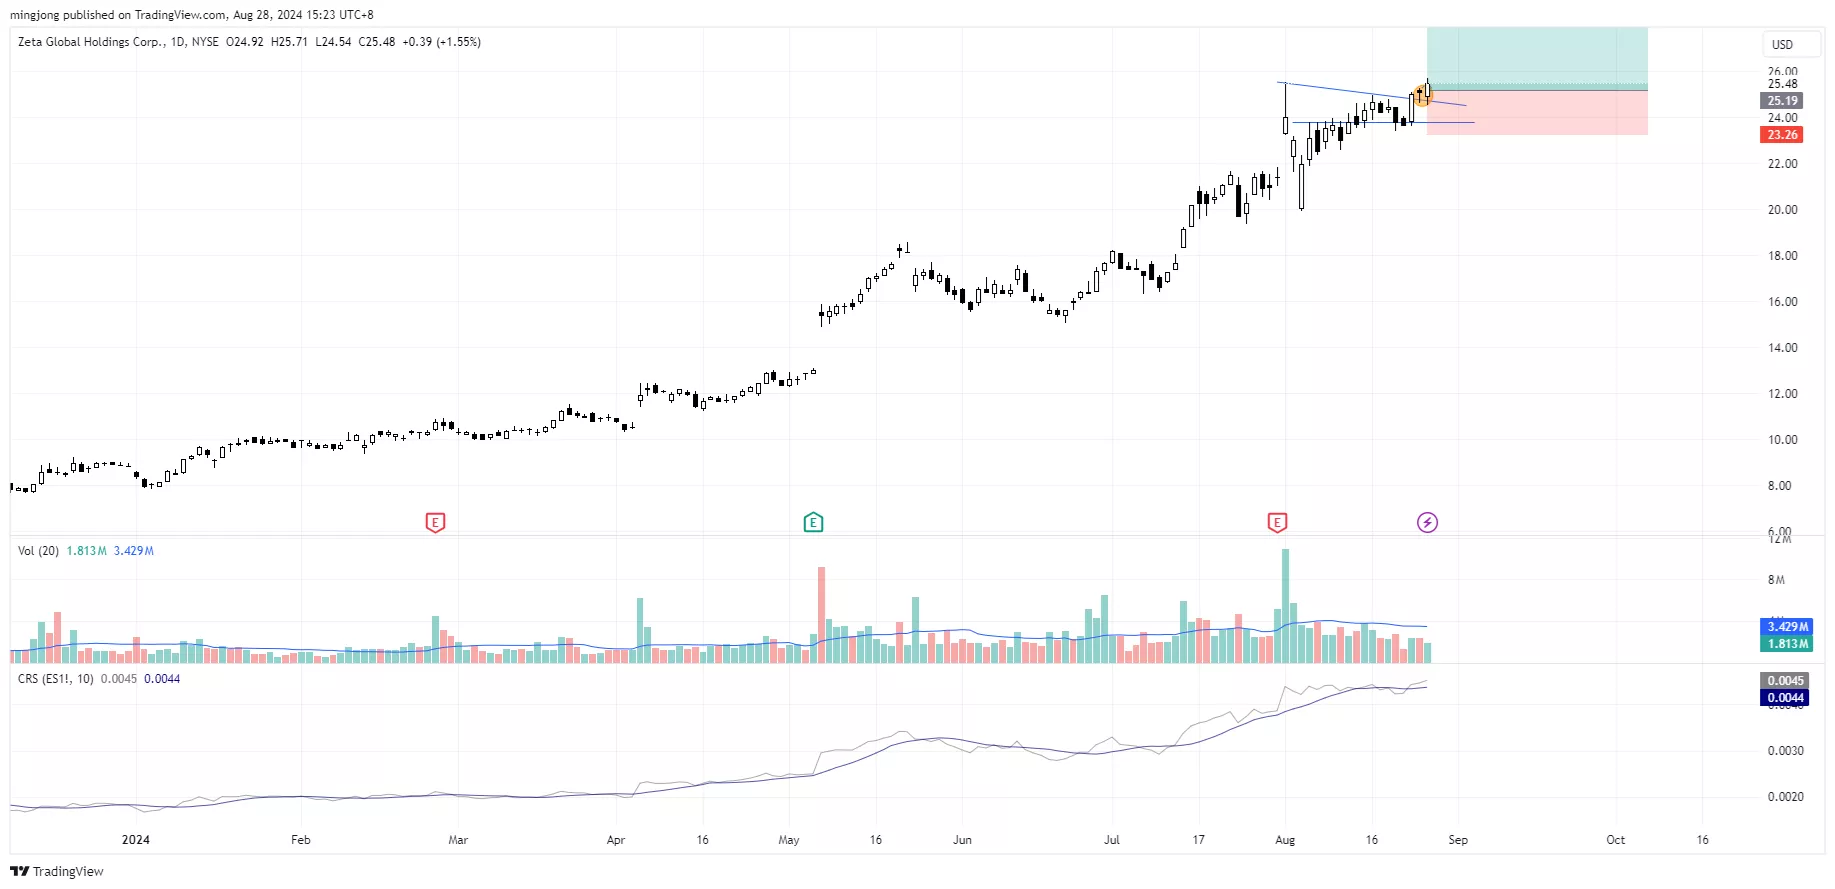
3 “low-hanging fruits” trade entries setups INSG, VTR + 22 actionable setups such as GEV were discussed during the live session before the market open (BMO).
More By This Author:
Why Low Volume In S&P 500 Could Be Signaling A Hidden Opportunity?
Is The Market Bottom Here? Will The S&P 500 Break Down Further?
This Volatility Signal Suggests A Bigger Drop Ahead!


Comments
Log in or sign up to join the conversation.