

Image Source: Unsplash
Watch the free-preview video extracted from the WLGC session before the market opens on 20 Aug 2024 to find out the following:
- What does the low trading volume in the S&P 500 indicate about current market conditions?
- What signals might indicate a reversal in the S&P 500’s uptrend?
- The significance of the "failure bar" in the S&P 500.
- The key level to watch out for a reversal in the S&P 500.
- And a lot more...
Video Length: 00:05:28
Market Environment
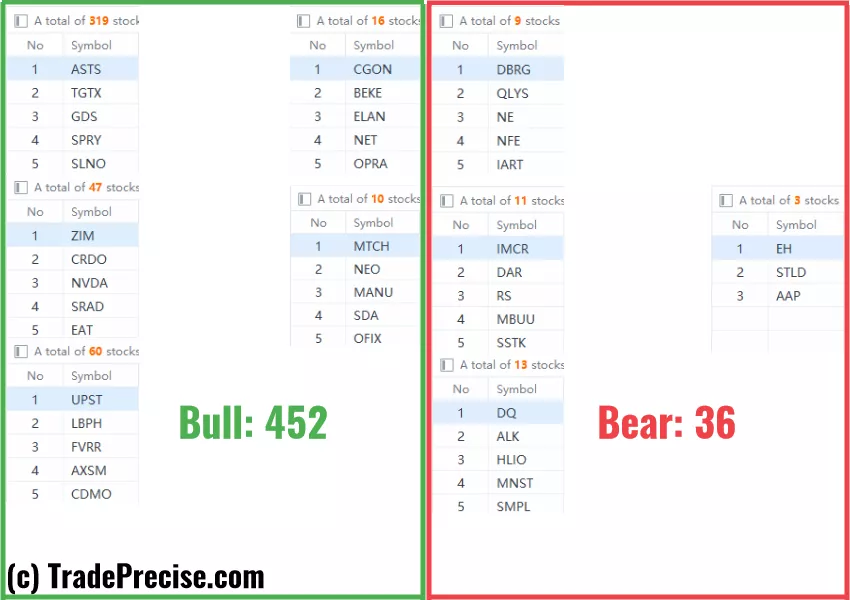
The bullish vs. bearish setup is 452 to 36 from the screenshot of my stock screener below.
Both the long-term and short-term market breadth have improved significantly. However, traders need to pay attention to the low supply rally and the implications as discussed in the video.
3 Stocks Ready To Soar
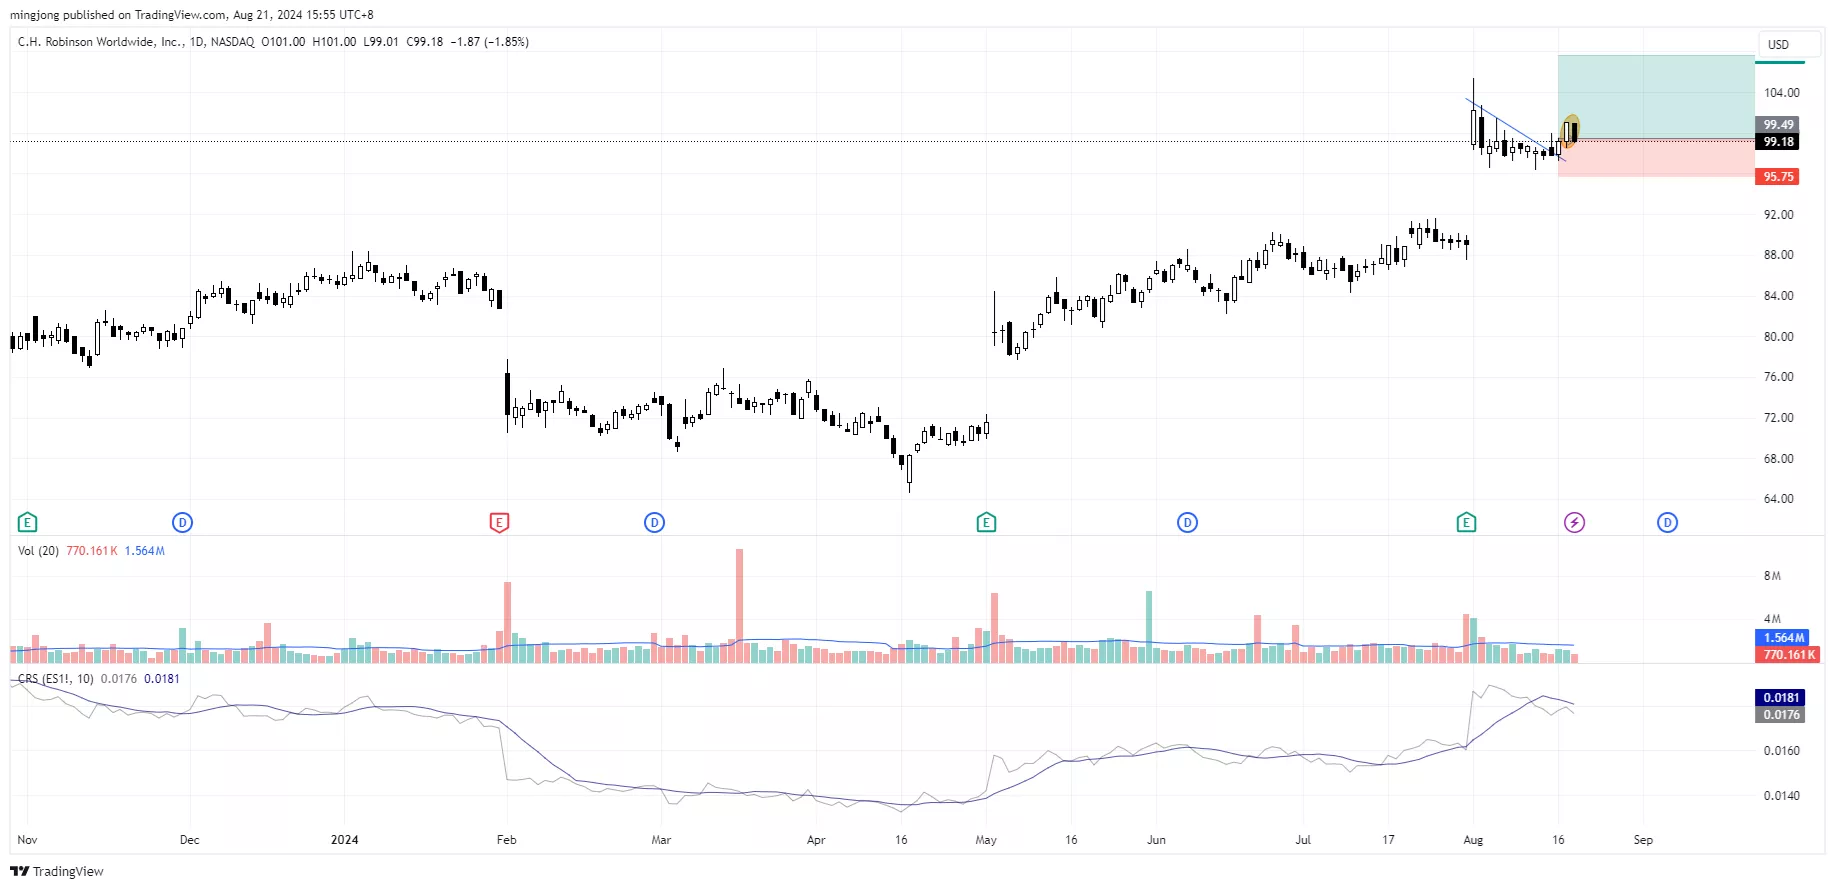
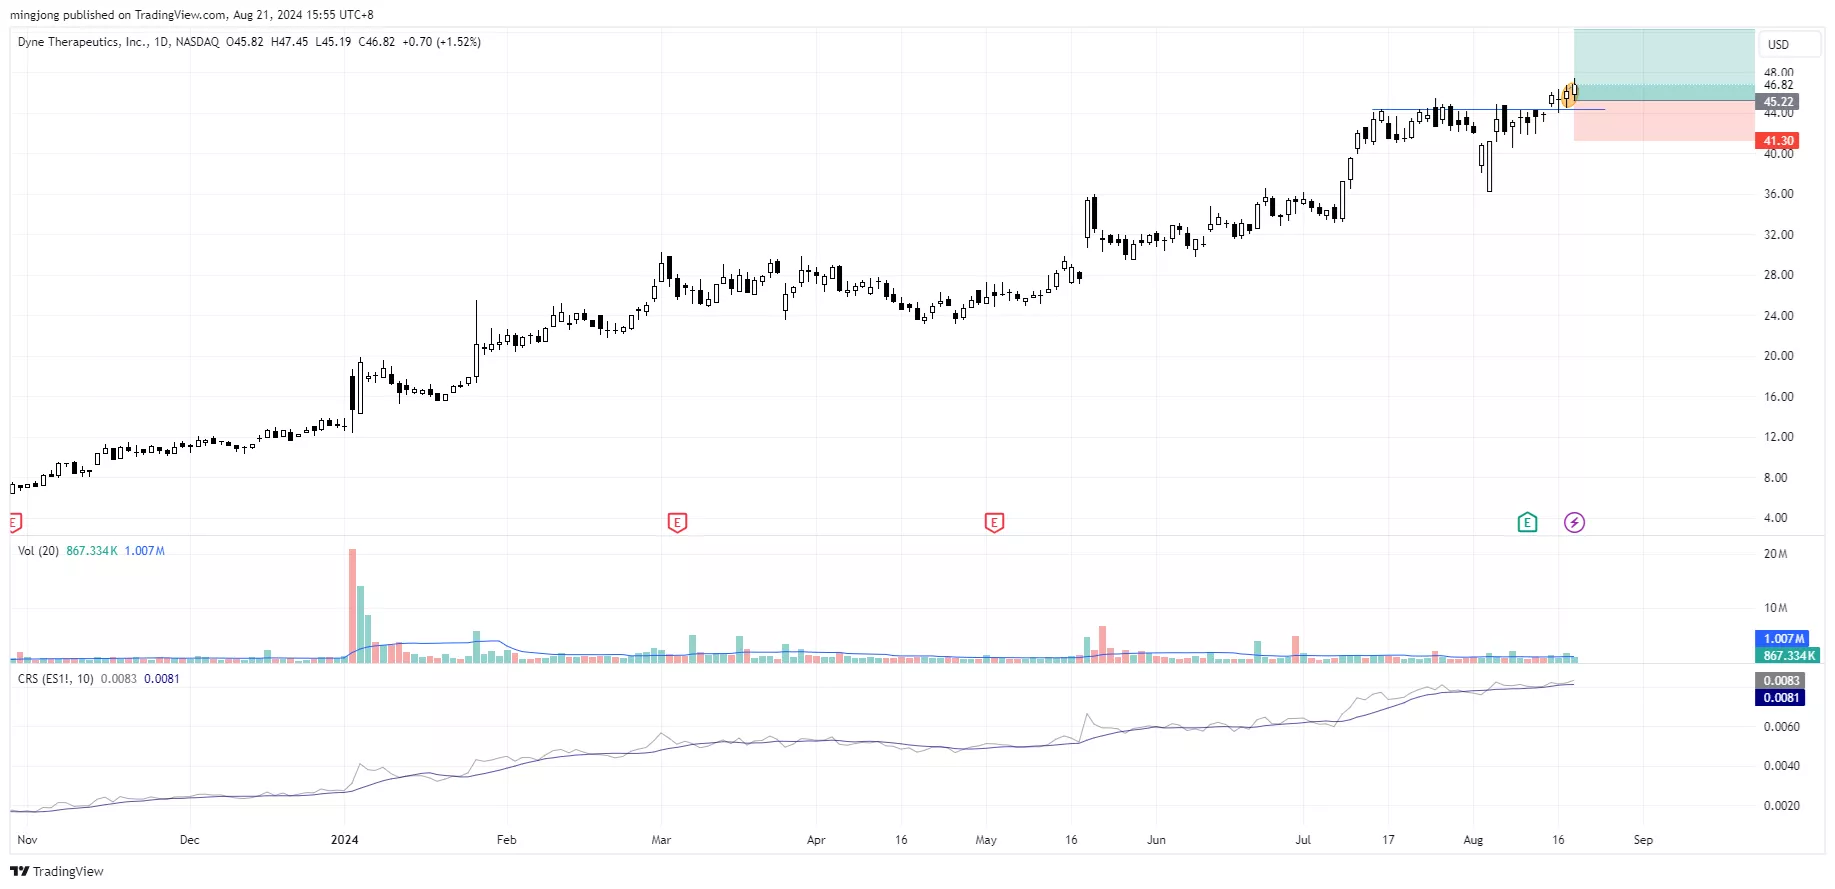
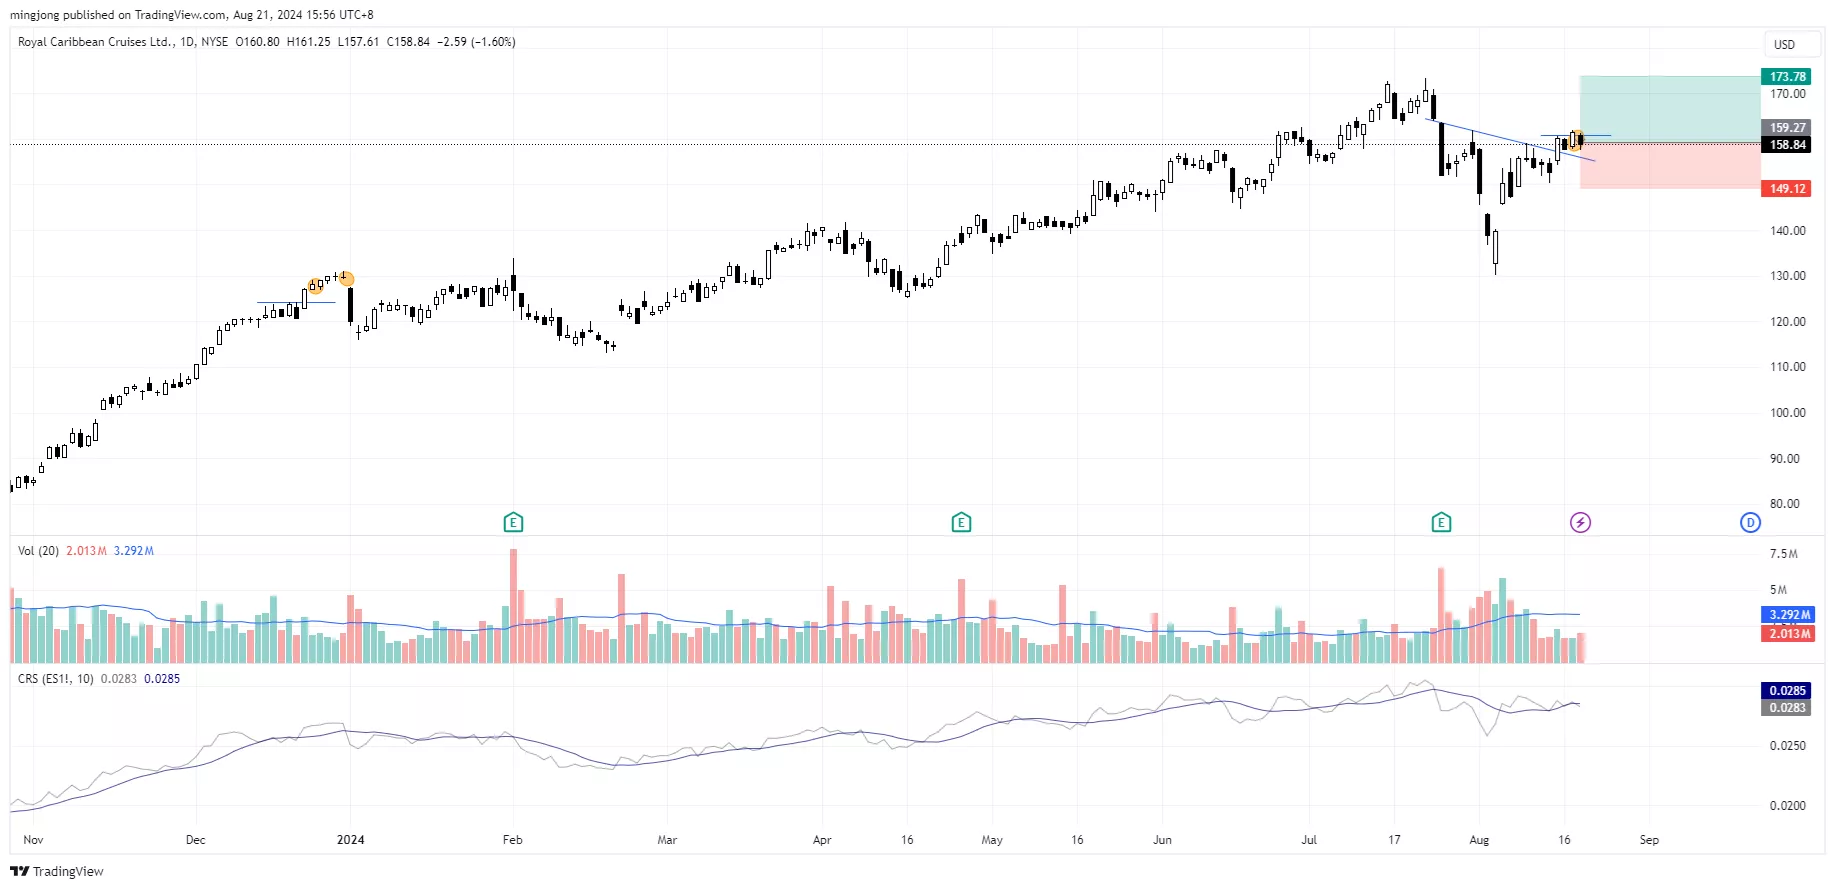
22 actionable setups such as CHRW, DYN, RCL were discussed during the live session before the market open (BMO).
The change of character as discussed in the video above suggests the market structure has changed. If I were to trade, I would cut down to 1/2 of the normal position size and use conservative trade management to protect the capital.
(Click on image to enlarge)
(Click on image to enlarge)
(Click on image to enlarge)
More By This Author:
Is The Market Bottom Here? Will The S&P 500 Break Down Further?
This Volatility Signal Suggests A Bigger Drop Ahead!
Bearish Momentum Alert: Here's Why The S&P 500 Could Break Down Soon


Comments
Log in or sign up to join the conversation.