"Sign Of Strength"
SPX Monitoring purposes; Long SPX on 2/6/23 at 4110.98
Monitoring purposes GOLD: Long GDX on 10/9/20 at 40.78.
Long Term SPX monitor purposes; Neutral

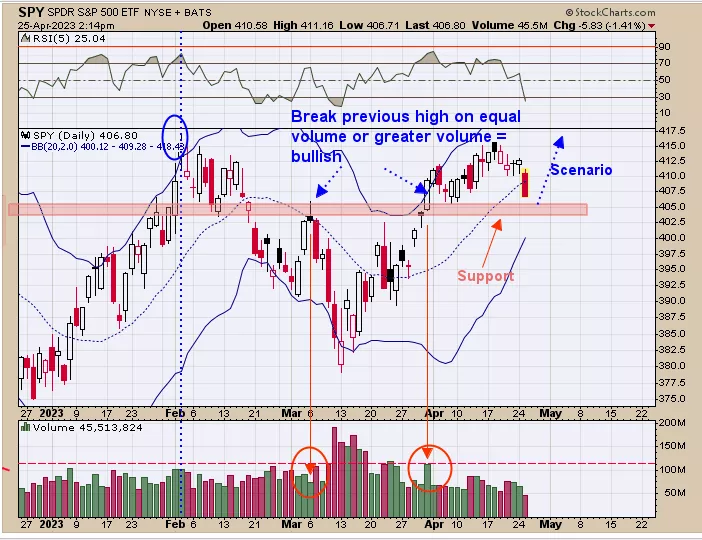
Don’t believe an extended decline is beginning here. March 31 jumped above the previous high of March 6 with a “Sign of Strength” (noted with red arrows), which suggests a valid break to the upside and now the previous high (March 6 high near 405 SPY) should act as support (light shaded pink area is support). The SPY is near the support now. Our thinking is that April is up 94% of the time in pre-election years the support near 405 SPY will hold and the market again will try to rally. (Food for thought; Pre-election years (this year) April is up 94% of the time. If January was up (it was up over 6%) April is up 88% of the time.”

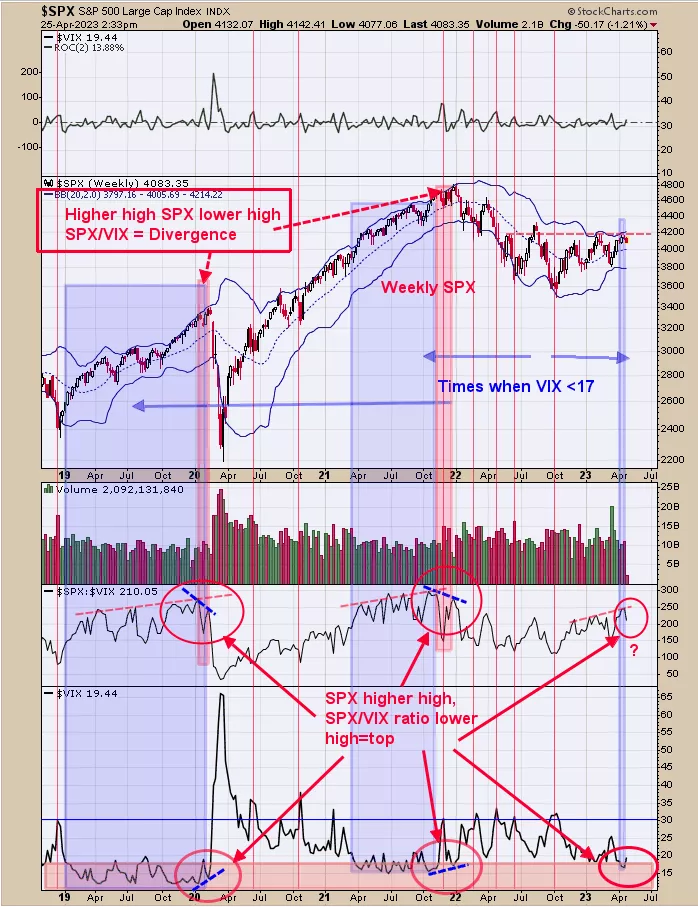
The bottom window is the VIX which touched a new short-term low yesterday. Worthwhile tops in the SPX usually don’t form when the VIX touches to a new short-term low. What can be troubling for the market is when the SPX trades at higher highs and the VIX trades at higher lows (circled in red on bottom window) where worthwhile tops can form. Page one suggests SPY is near support near the 405 level. If the market does rally from support and trades to a new short-term high while VIX fails to trade to a new short-term low will be a negative divergence. If the market rallies to new short-term highs while VIX trades to new short-term lows will be a positive divergence.
More By This Author:
Signals are provided as general information only and are not investment recommendations. You are responsible for your own investment decisions. Past performance does not guarantee future performance. ...
more


