

Image Source: Pexels
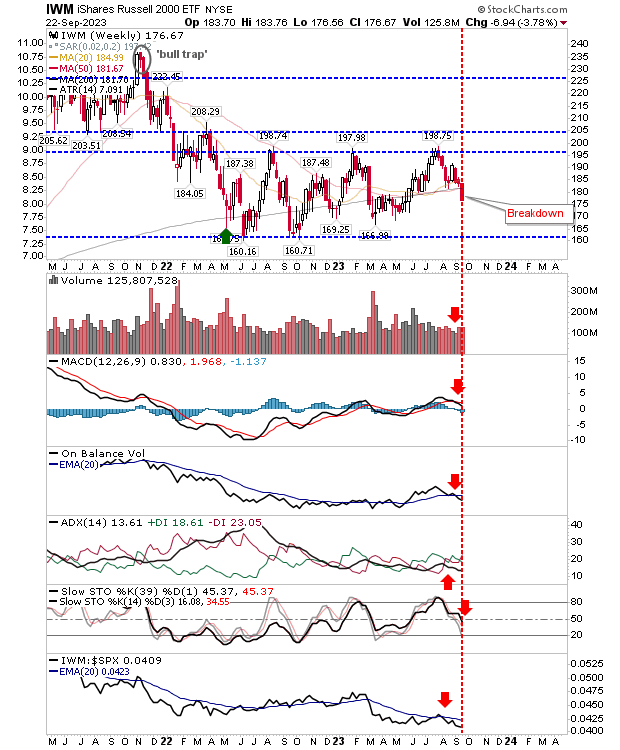
While the Russell 2000 index has recovered from breaks of its 200-week MA before, every such test (and break) of the moving average increases the chance of a flip from a level of support to resistance.
Supporting technicals for the index are bearish. More importantly, since the sharp shift in relative performance against the S&P 500 in March, the index has struggled to regain the initiative. Additionally, the summer rally barely registered in terms of relative performance. This means the likelihood for a move to an oversold state is high, and therefore further losses could be expected at this point.
(Click on image to enlarge)
The Nasdaq will be next to see a test of support as the 13,000 level comes into view. Unlike the Russell 2000, it has overbought momentum and (just about) bullish trend strength.
On-balance-volume has moved to a 'sell' trigger, following the earlier 'sell' trigger in the MACD. The 50-week MA has created a 'golden cross' with the 200-week MA, albeit from a relatively flat starting point. Given the aforementioned action in the Russell 2000, what is likely to come next is not good news.

(Click on image to enlarge)
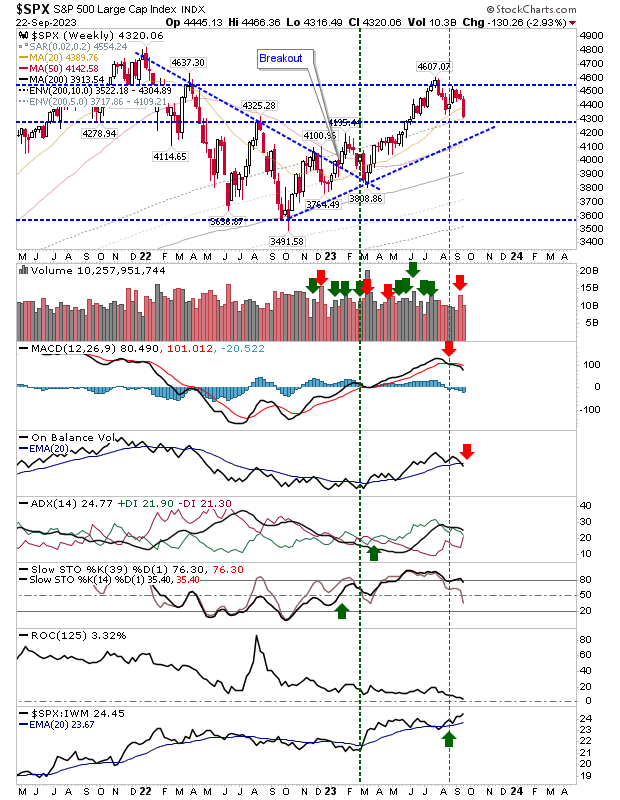
The S&P 500 weekly chart sits in a similar predicament to the Nasdaq, with 4,325 support being key. It has been seeing 'sell' triggers in the MACD and On-Balance-Volume, along with more bullish signals in ADX and Momentum. It does have a key advantage in that it's outperforming the Russell 2000, which means that if buyers do emerge to support the indices, they will be buying into the S&P 500 first.
(Click on image to enlarge)
Thus, there's two ticks in the bull column for the S&P 500 and Nasdaq on the weekly chart, and one tick in the bearish column for the Russell 2000. Unfortunately, its small-cap stocks that do most of the talking when it comes down to market leadership, and they are saying 'sell.'
At the very least, you can look for support tests in the S&P 500 and Nasdaq. Taking a look at what the Russell 2000 is doing at that point will give us an idea as to what happens next.
More By This Author:
Two Days Of Selling Has Us Looking At Market Breadth Metric
Russell 2000 Undercuts 200-Day MA As Indices Struggle
S&P 500 And Nasdaq Flag Distribution Heading Into Next Week's Fed Decision


Comments
Log in or sign up to join the conversation.