
It has been a rough summer for investors with markets pushing losses for the last few months. It's not all doom and gloom, with markets more range-bound than permanently damaged.
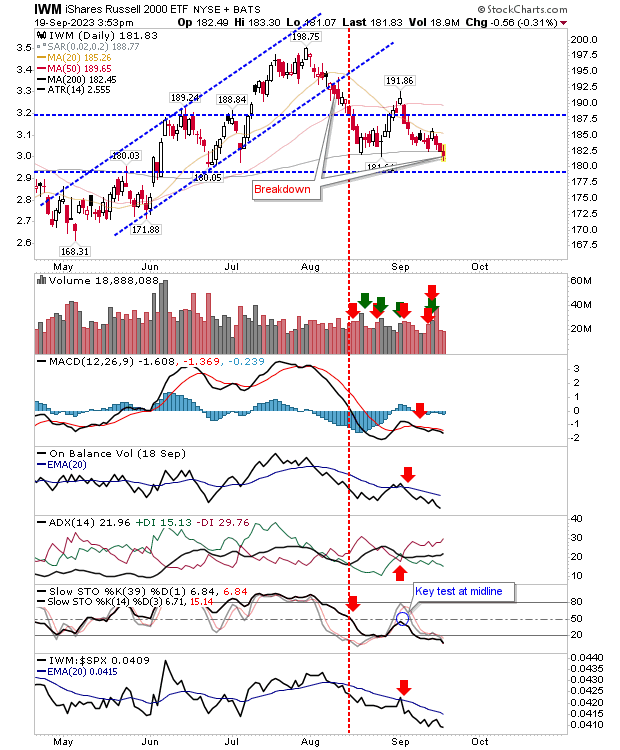
The Russell 2000 (IWM) got the pillorying today as it undercut its 200-day MA on distribution volume. Technicals are net bearish with momentum oversold, but there is another nearby price support level around $178 to lean on. While today's action sits firmly in the bearish camp, it will take a lot more selling to reverse the June 'Golden Cross' between the 50-day and 200-day MAs, and in its current oversold state, there is a good chance for a bounce of merit.
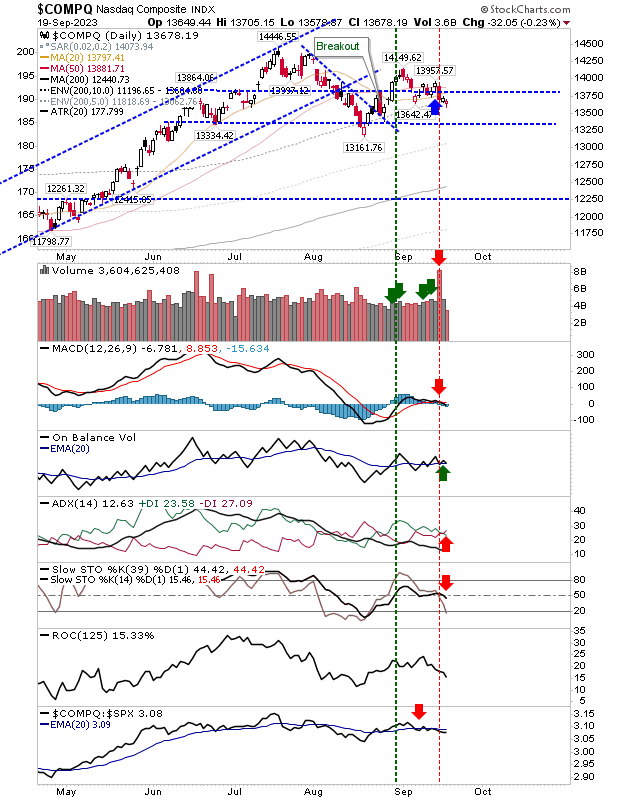
The Nasdaq is still feeling the hangover from Friday's selling as it struggles to deal with the loss of its 50-day MA. Aside from On-Balance-Volume, technicals are bearish and the index is underperforming relative to the S&P. Volume remains light. Yesterday's and today's candlestick did feel like some attempt to rectify these losses, but this trading action lacked conviction.
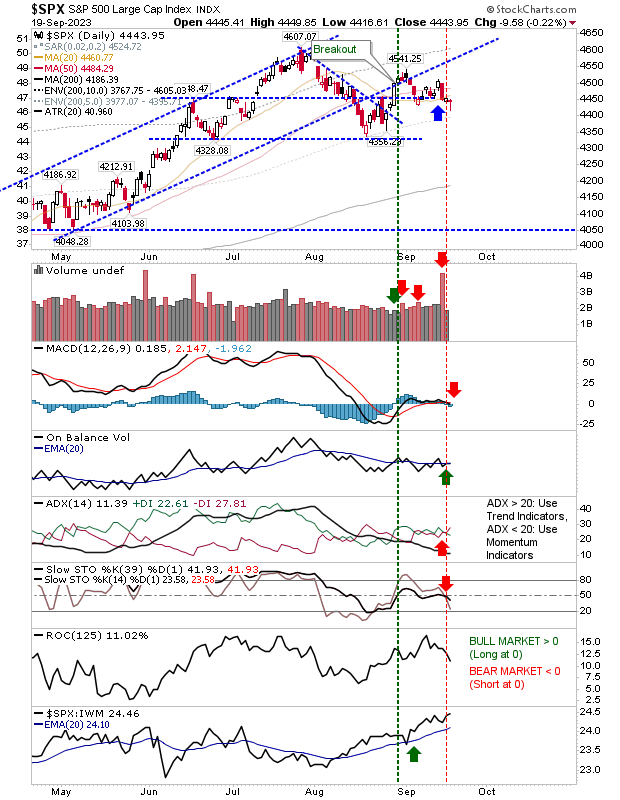
The S&P performed a little better with a 'dragonfly' doji, this candlestick is traditionally seen as a strong reversal candidate, but momentum isn't oversold. Reversal candlesticks perform best when they occur at an oversold state./p>
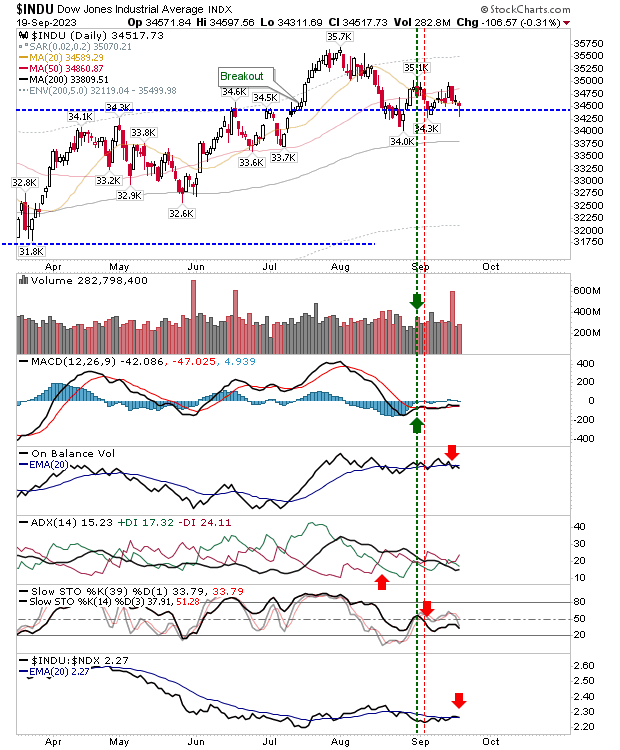
One index that is an interesting juncture is the Dow Jones Industrial Average. It too finished with a bullish doji, but a doji bang on key price support. Volume did rise to mark distribution, but by holding support such volume is better seen as buying. An aggressive trader could be a buyer here, although it would be bucking the technical picture.
For the coming week, bulls we want to see the 'dragonfly' doji for Large Cap indices hold, building out to a return above the 50-day MA for the Russell 2000 (IWM). The other chart I'm watching is the Russell 2000 (IWM) weekly chart. It's marking a key test of the 200-week MA; a loss of this moving average in this time frame would be far more serious, but we need to wait until next week to find out.
More By This Author:
S&P 500 And Nasdaq Flag Distribution Heading Into Next Week's Fed DecisionSuccessful Test Of 200-Day MA In Russell 2000
Russell 2000 Lingers At 200-Day MA


Comments
Log in or sign up to join the conversation.