
SPX Monitoring purposes; Long SPX 10/27/23 at 4117.37.
Gain since 12/20/22= over 26%.
Monitoring purposes GOLD: Long GDX on 10/9/20 at 40.78.
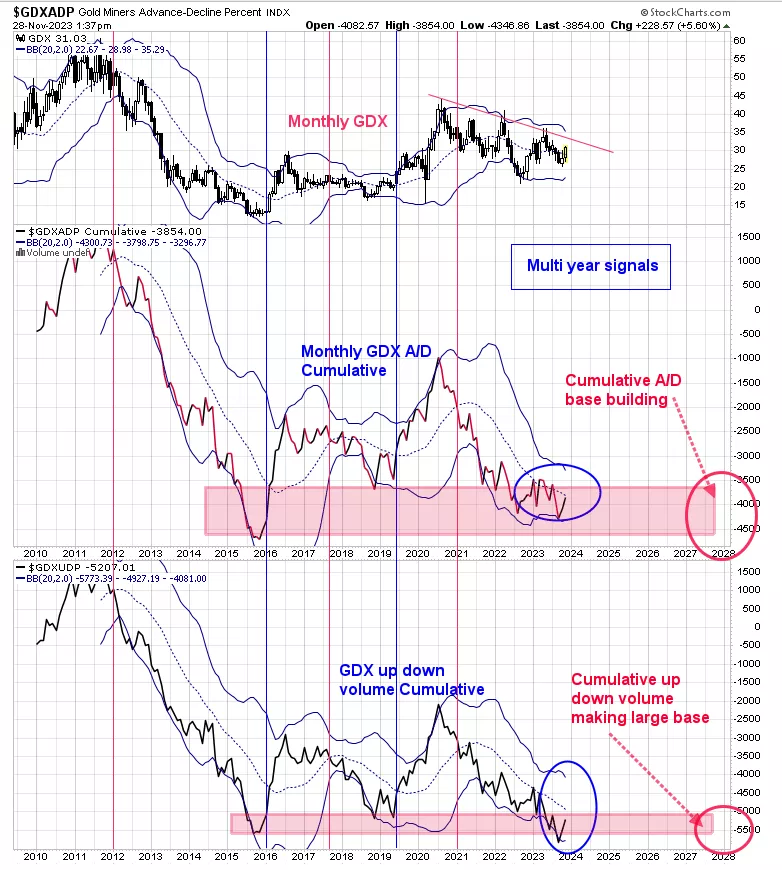
There is a very good likelihood of a multi year signal triggered for GDX in the coming months. The above chart is on the monthly time frame. The bottom window is the GDX cumulative Up down volume percent and next higher window is the GDX cumulative Advance/Decline percent. These signals are generated after a bottom is in but once they are triggered the signal can last many months or years. Bullish signals are generated when both indicators close above its mid Bollinger bands (noted with blue lines) and bearish signals when both indicators close below its mid Bollinger bands (noted with red lines). Both monthly indicators reached near the 2016 low (noted with pink shaded areas) noting an oversold market. The last sell signal came in early 2021 (nearly 3 years ago) is now nearing a bullish crossover of the mid Bollinger band which may take another month of two. We do have evidence that a worthwhile low has formed already and a bullish mid Bollinger band crossing of both indicators above will signal a multi month if not a multi year rally is coming.
More By This Author:
Consolidation Week
Buy Signals For Gold Miners ETF
“Zweig Breadth Thrust”


Comments
Log in or sign up to join the conversation.