

SPX Monitoring purposes; Sold SPX 10/18/23 at 4314.60 gain .35%; Long SPX 9/28/23 at 4299.70.
Gain since 12/20/22=16.30%.
Monitoring purposes GOLD: Long GDX on 10/9/20 at 40.78.
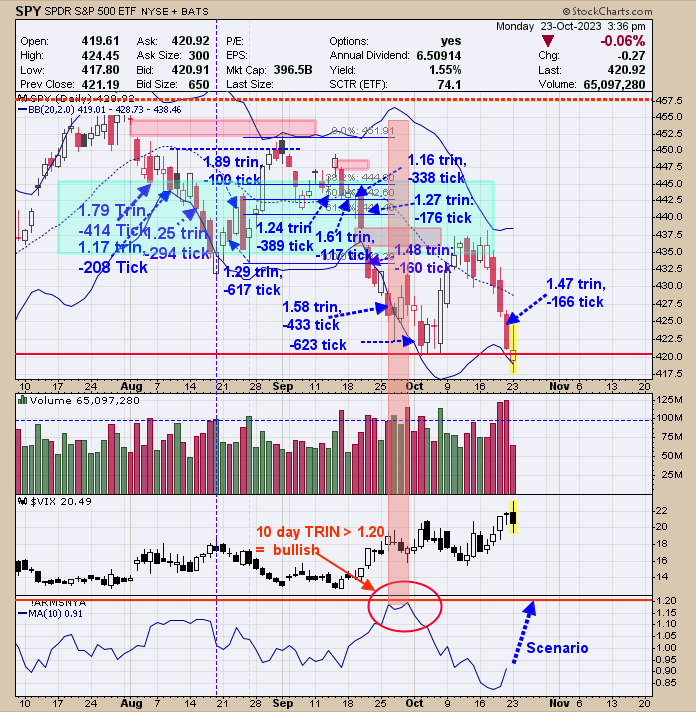
The bottom window is the 10 day average of the trin and the top window is the daily SPY. In the coming days we would like to see the 10 day TRIN rally back to panic levels near 1.20 or higher; as we have said in the past panic forms near lows in the market. We labeled in blue the times when the TRIN and Tick readings reached bullish level; on Friday the Trin closed at 1.46 (bullish) and the tick closed at -166 (leans bullish). Today the SPY was down 5 day in a row which predicts market will be lower 83% of the time within 5 days. Bottom may not be far off.
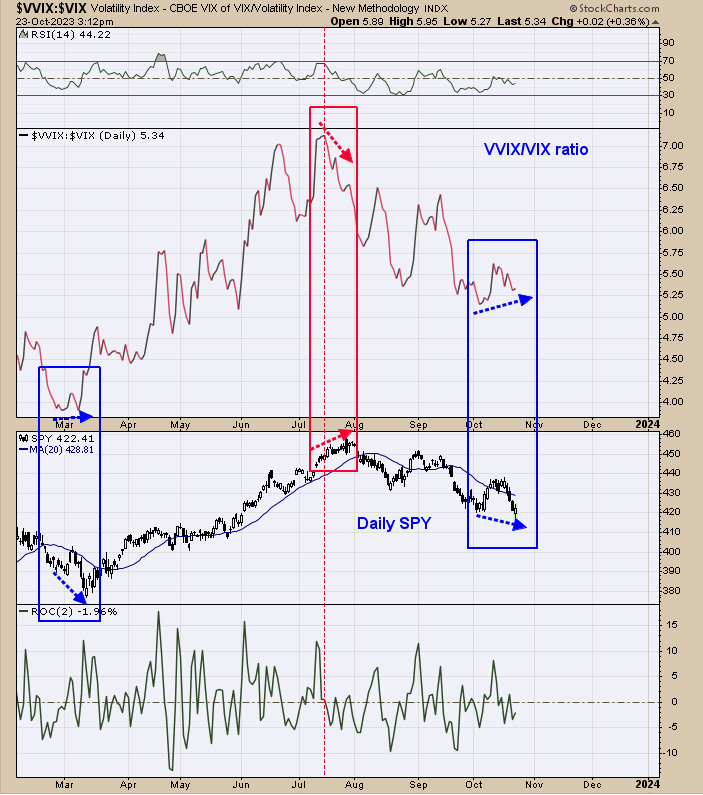
A positive divergence is present. Above is the daily VVIX/VIX ratio. Its common at reversal in the SPY that the VVIX/VIX ratio produces a divergence. The chart above goes back to February and shows the times here SPY made lower lows and the VIX/VVIX ratio made higher lows (positive divergence; blue squares) and the times where SPY made higher highs and the VIX/VVIX ratio made lower highs (bearish divergence; red square). We did have a bullish TRIN close on Friday of 1.47 and a some what bullish tick close of -166. Also worth noting is that market is near the 420 SPY support. We do have bullish signs but no bullish trigger. Staying neutral for now.
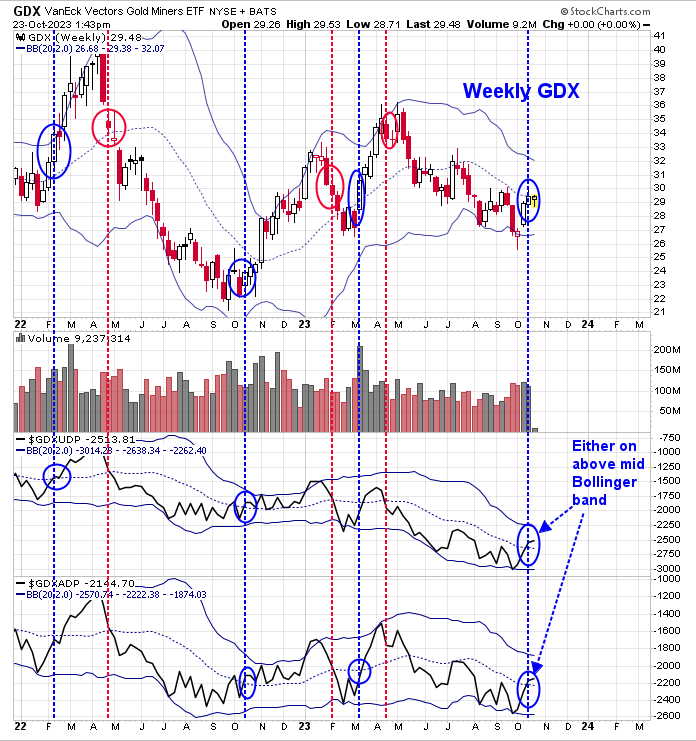
The top window is the weekly GDX graph. Next lower window is the weekly cumulative GDX up down volume percent and next lower window is the weekly cumulative GDX up down volume percent. This chart goes back near two years. We added the Bollinger bands to the bottom two indicators. Bullish and bearish signals are triggered for GDX when either or both indicators close above (bullish) or below (bearish) their mid Bollinger bands. The red dotted lines on the chart above when a bearish signal is triggered and the dotted blue lines when a bullish signal is triggered. Last week both indictors closed above their mid Bollinger bands trigging a buy signal. Signal usually last two to 6 months.
More By This Author:
“Zweig Breadth Thrust”Option Expiration Week - Tuesday, Sept. 12
New Short-Term Lows


Comments
Log in or sign up to join the conversation.