
SPX Monitoring purposes; Long SPX 10/27/23 at 4117.37.
Gain since 12/20/22= over 23%.
Monitoring purposes GOLD: Long GDX on 10/9/20 at 40.78.
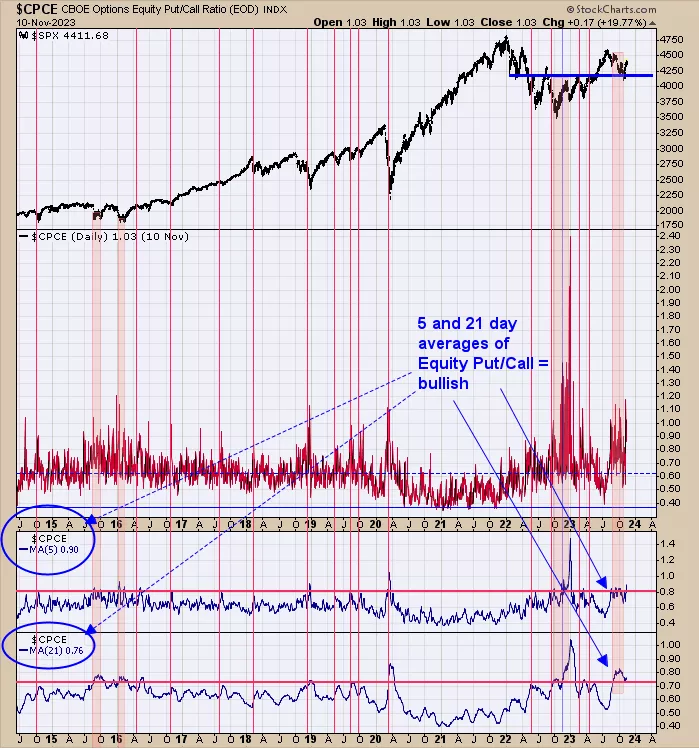
Above is a sentiment indicator which is the CBOE 5 and 21 day Equity put/call ratio. The red lines and pink shaded areas are times when the 5 and 21 day Equity put/call ratio reached bullish levels for the market. Its interesting that the SPX went straight up over the last couple of weeks and the put/call players lean solidly bearish; both on the weekly and monthly timeframe which in turn is bullish. There could be a consolidation this week but next week (Thanksgiving week) seasonality leans bullish and with the put/call ratio remaining in bullish territory the SPX rally may continue. We are long SPX 10/27/23 at 4117.37.
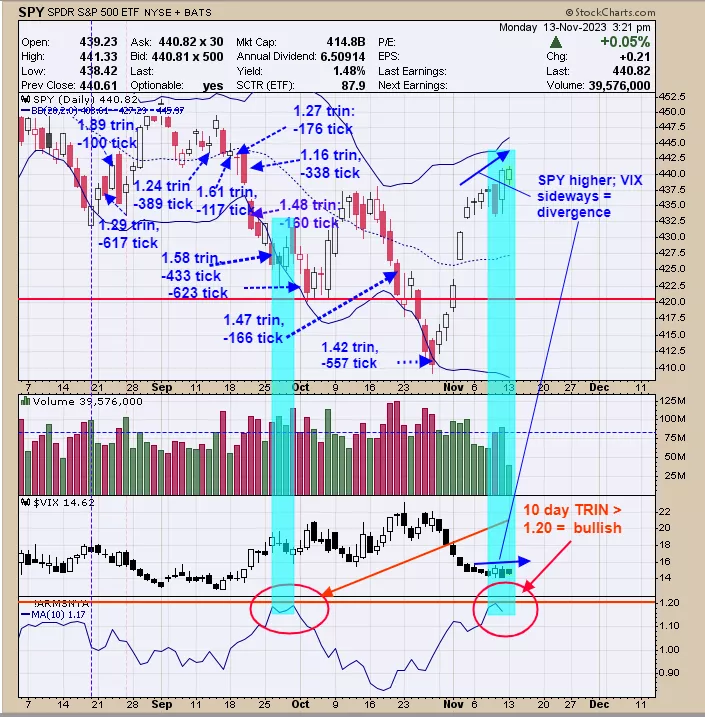
This week is the 10th worst week of the year for performance and could see a pull back. The bottom window is the 10 day average of the TRIN; readings near 1.20 and higher are bullish for the market; the current reading is 1.17 which leans bullish. Next higher window is the VIX. Readings below 17 suggests the market is in a trending mode (current reading is 14.62). Also notice that the SPY has made higher highs and the VIX has flipped sideways over the last several days which are a negative divergence. There is a possibility of a pull back but 10 day TRIN and pull/put call ratio (page 1) suggests ultimately the market will move higher.
More By This Author:
Buy Signals For Gold Miners ETF
“Zweig Breadth Thrust”
Option Expiration Week - Tuesday, Sept. 12


Comments
Log in or sign up to join the conversation.