
SPX Monitoring purposes; Short SPX on 9/1/23 at 4515.77; cover short 9/5/23 at 4496.83 = gain .43%.
Gain since 12/20/22=15.93%.
Monitoring purposes GOLD: Long GDX on 10/9/20 at 40.78.
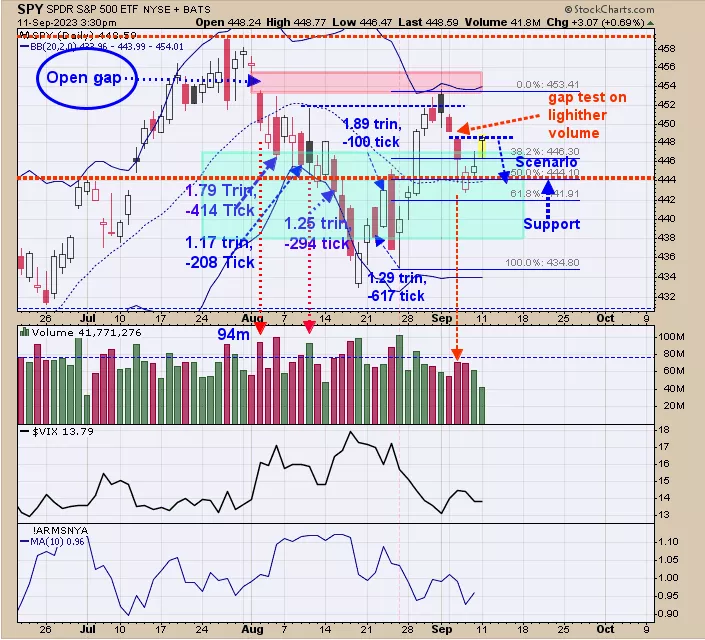
Today’s trading tested the gap of 9/6 on lighter volume suggesting the gap has resistance and the market could stall near current levels. Options expiration week leans bullish which is this week. The bottom window is the 10-day average of the TRIN which stands at .99; readings near 1.20 and higher are bullish. This low of a 10-day TRIN suggests the market may not have enough panic to push higher. The next higher window is the VIX with a reading of 13.79; readings below 17 lean bullish. The market is not giving a clear signal. SPY could drop back to support near 444 and if panic is present could start a rally and if not present the 444 SPY support may fail. Not a clear signal will stay neutral for now.
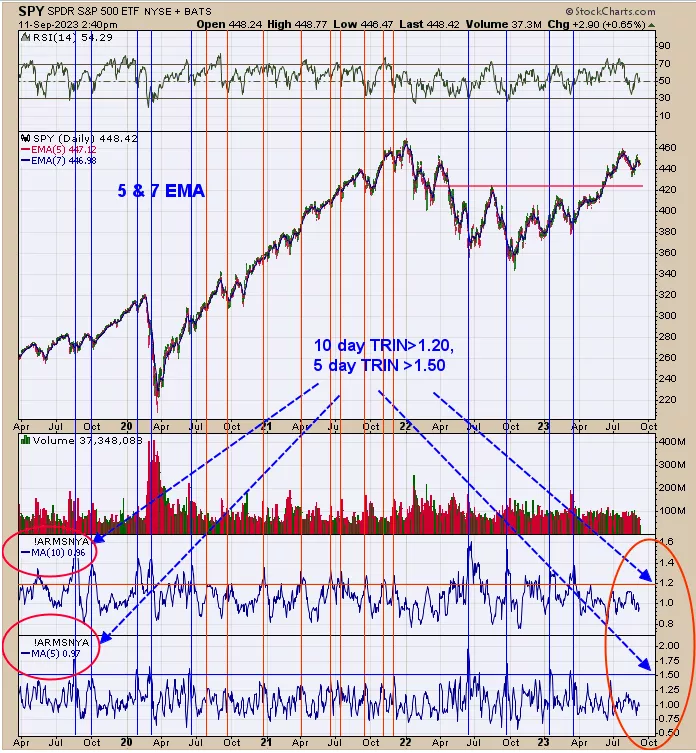
Last Thursday we presented the SPX/VIX ratio which leaned bullish (see last Thursday’s report). The bottom window in the chart above is the 5-day average of the TRIN and the next higher window is the 10-day average of the TRIN. When the 5-day TRIN reaches 1.50 and the 10-day TRIN reaches 1.20, a market low is near. The blue lines show when both 5 and 10-day TRIN reaches bullish level and the red lines show only when the 10-day TRIN reaches bullish levels. Currently, both 5 and 10-day TRINS are not near bullish levels. The TRIN closes help to identify panic and panic form near lows in the market. Right now the TRIN reading are not near levels where a worthwhile low is forming. There can be short-term bounces, but a lasting low has not formed yet according to the TRIN indicators.
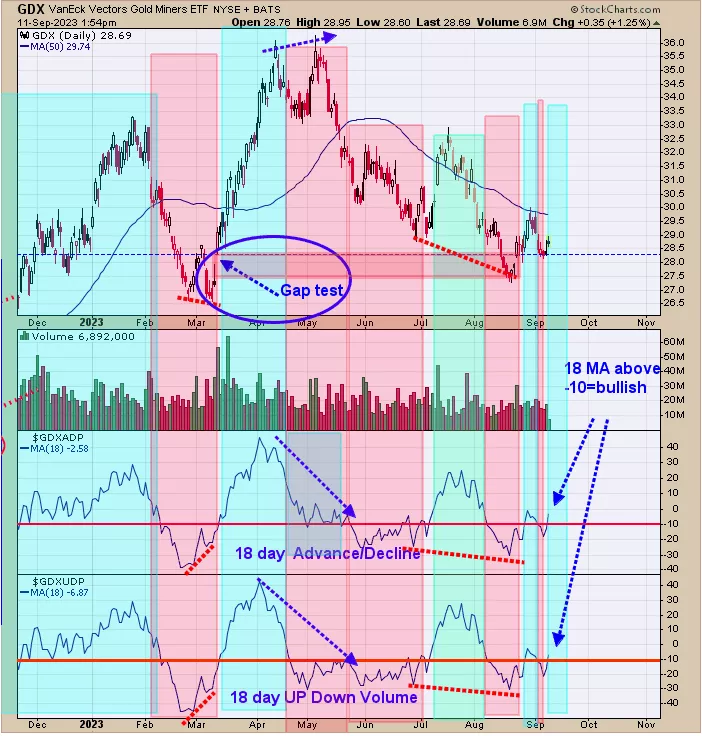
The bottom window is the 18-day average of the Up down volume percent and the next higher window is the 18-day average of the advance/decline percent (both for GDX). This chart looks at the shorter timeframe where signals can last as little as a week to as long as several months. The chart on last Thursday’s report for GDX looked at the big picture where signals last year. Currently, both indicators closed above -10 and on a buy signal, and as long both indicators remain above -10 the buy signal will continue. We also have these indicators on a 50-day average which looks at the intermediate term where signals can last several months. These indicators trigger buy signals when both close above “0”; currently both are coming in near the -2 range and may kick in a buy signal in the coming days.
More By This Author:
New Short-Term Lows
Option Expiration Week
Gold Miners and SPY - Go Long


Comments
Log in or sign up to join the conversation.