Macroeconomic And Geopolitical Shifts - Strategic Or Tactical?

Image Source: Pixabay
Between inflation skyrocketing beyond expectations, the drumbeats of war, and increasing global sanctions on Russian Oil, macroeconomic and geopolitical themes have dominated the 2022 stock market 15 weeks into the year. Throwing out derivative-based ETFs, the top 11 US ETFs ranked by price performance this year are primarily focused on energy companies. Let's start with the obvious.
The top three covered by ValuEngine are:
- XES, SPDR S&P Oil & Gas Equipment & Services ETF;
- IEZ, iShares U.S. Oil Equipment & Services ETF;
- PXE, Invesco Dynamic Energy Exploration & Production ETF
XES and IEZ both quite similar and focused on equipment and services companies led by Schlumberger (SLB, VE rating = 3, market performer) and Halliburton (HAL, VE rating = 3, market performer) are rated 4 by ValuEngine (Outperform). Conversely, PXE is rated 1 (greatly underperform) by ValuEngine. This is a counterintuitive but important distinction given that both are in the Energy sector and PXE, led by Occidental Petroleum (OXY, VE rating = 3, market performer) and Valero Energy (VLO, VE rating = 2, underperform), consists of the major customer bases of the companies in XES and IEZ. Therefore, our models see the spike in interest in drilling companies as a cyclical trend that is destined to lose steam eventually in contrast to the equipment manufacturers that are perceived as having stronger balance sheets and earnings streams. Nevertheless, beyond a few years and using a lens for stocks and ETFs that investors should look to hold for the next five years, most analysts would agree that firms dependent on demand for carbon-based energy products will be the best place for long-term investors to put their money. So, not only does the economic Sector matter but the industry matters in analyzing ETFs even in a sector-rotation-focused market.
Indeed, the list of top 60 performing ETFs year-to-date as of April 15, 2022, is dominated by sector and industry ETFs, followed by ETFs holding high dividend yields and low volatility stocks. For each group, the ETFs fitting one of these categories has moved together from week to week thus far. All of these ETFs and 42 more fitting these categories have positive returns year-to-date bucking the overall market trends. All-in-all, this has been an especially seductive year for managers and investors employing ETFs in macro-focused rotation strategies. Many accomplished market experts are calling for the shift into a more old economy and more value-oriented assets to have staying power for about three years. If this is true, we move beyond tactical rotation to strategic rotation because historically, market shifts from growth to value have been cyclical. I believe this to be an oversimplification and that too much of a strategic shift into old energy and mining stocks could collapse as fast as a rickety old mind shaft. Time will tell about that. Other shifts such as income and low volatility may have more staying power in my opinion.
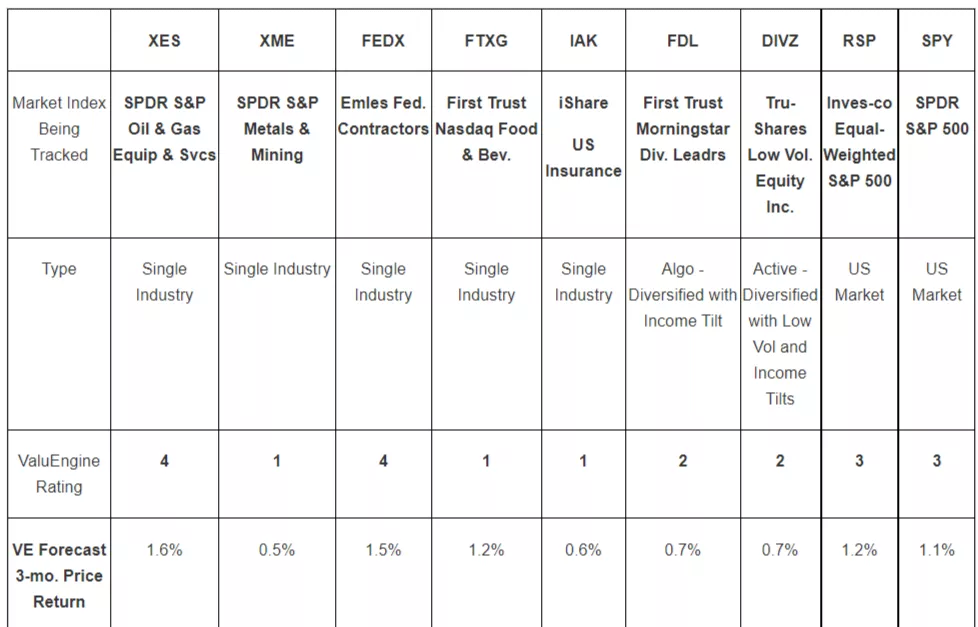
The pronounced rotation character of this market is why we refer to this as a “Volleyball Stock Market.” In turn, each sector rotates until its turn to “serve.” So, in lieu of detailing the top seven performings ETFs all in the energy sector, this analysis takes more of a stratified sampling approach. This week’s analytic table contains the top-performing ETFs of the ETFs in each sector or industry group as the first one fitting a new category appears in the list. The data available from ValuEngine reports are supplements from data and reports made available by ETF.com.
This week’s analysis includes one top performer in 7 categories followed by two benchmarks:
- XES, SPDR S&P Oil & Gas Equipment & Services ETF. XES tracks an equal-weighted index of companies in the oil & gas equipment and services sub-industry of the S&P Total Market Index;
- XME, SPDR S&P Metals & Mining ETF. FCG tracks an equal-weighted index of US metals and mining companies;
- FEDX, Emles Federal Contractors ETF. FEDX tracks a market-cap-weighted index of fundamentally-selected US firms that derive a large portion of their revenue from Federal contracts;
- FTXG, First Trust Nasdaq Food & Beverage ETF. FTXG follows a liquidity-selected, multi-factor-weighted index of US food & beverage companies;
- IAK, iShares US Insurance ETF. IAK tracks a market-cap index of US insurance companies;
- FDL, First Trust Morningstar Dividend Leaders; FDL tracks a dividend-weighted index of US companies with consistent and sustained dividend payments. The fund holds roughly 100 securities and excludes REITs.
- DIVZ, TrueShares Low Volatility Equity Income ETF; DIVZ holds an actively-managed, concentrated portfolio of US-listed companies that are favorably valued and have attractive dividends. The fund also seeks to deliver lower volatility than the overall market.
- RSP, Invesco S&P 500 Equal Weight ETF, tracking an equally weighted index of S&P 500 companies that is rebalanced quarterly. It is included as a 2nd benchmark because most of the outperforming strategies YTD have not been weighted by market capitalization.
- SPY, SPDR S&P 500 Index ETF Trust; SPY tracks a market-cap-weighted index of US large- and midcap stocks selected by the S&P Committee.
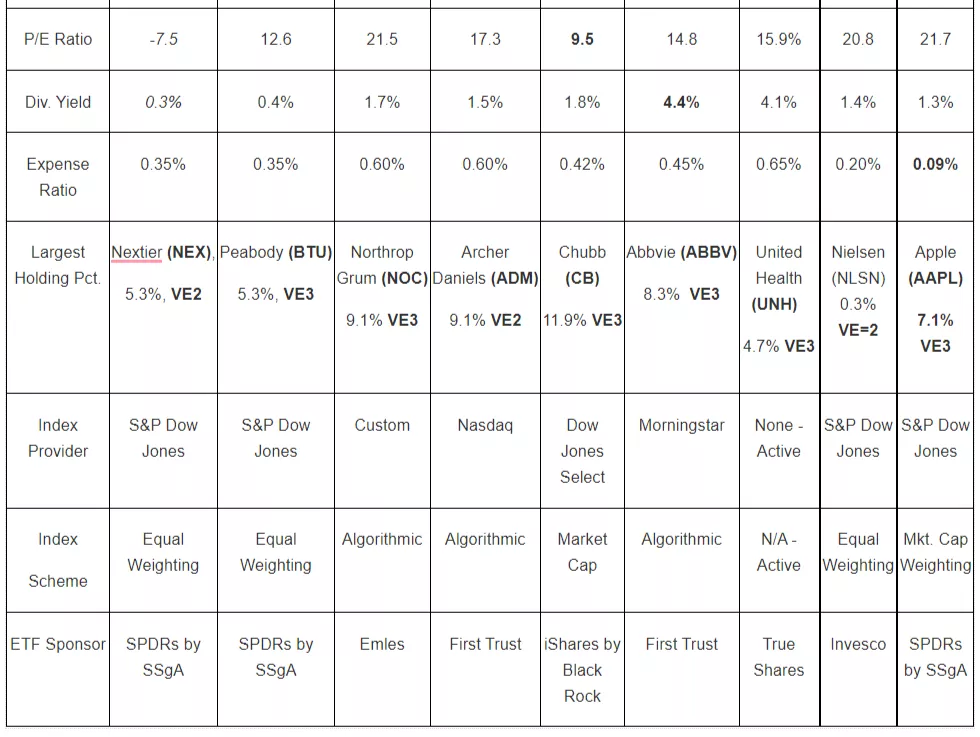
Interestingly, although SPDRs by State Street, iShares by BlackRock, First Trust, and Invesco are among the best-known ETF providers, Emles Advisors and TrueShares are not. Both are part of a growing trend during the past few years of financial services and hedge fund entrepreneurs starting ETF companies with specific concepts in mind. Emles ETFs tend to use algorithmic indexes to mimic active management strategies while TrueShares is 100% active by design. Other innovative new families fitting the general description include among others: Asymmetric Shares; Engine No. 1; R3; and V-Square. It is difficult enumerating all that have launched since 2018 and the legion just keeps expanding.
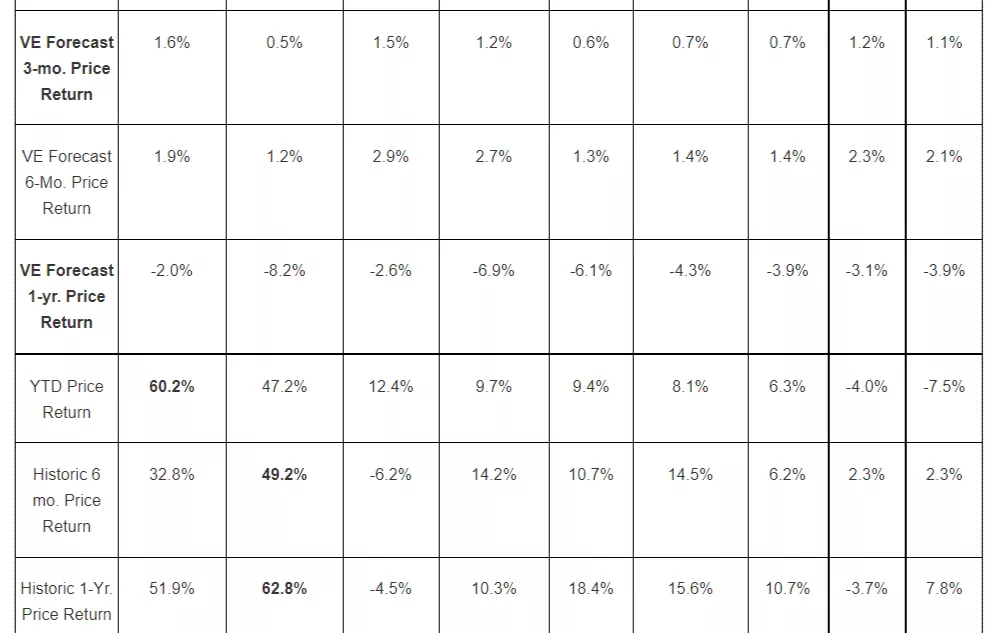
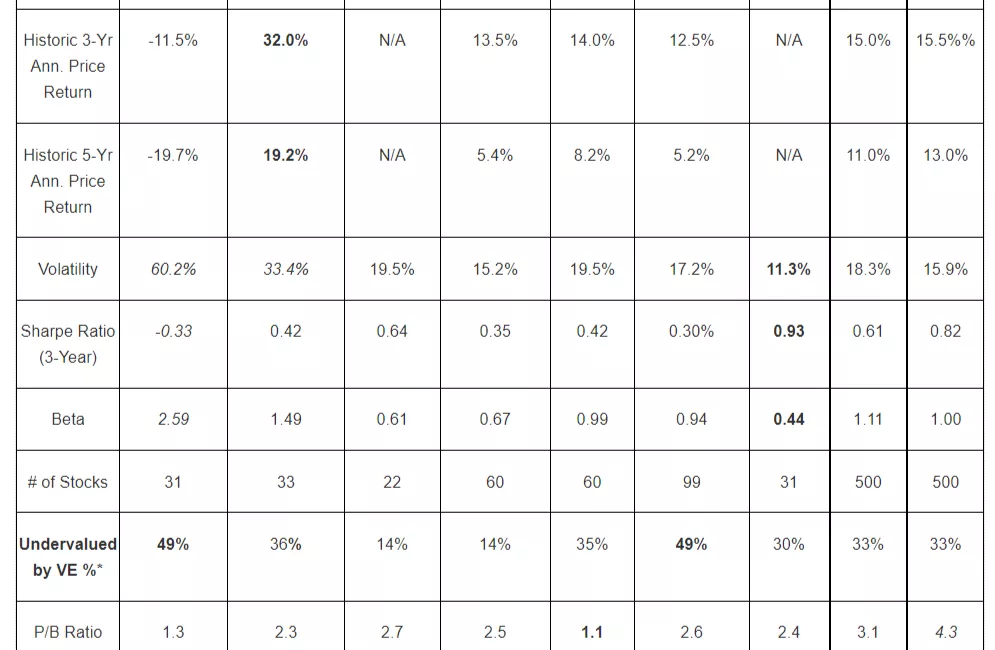
That said, the analytic table below shows as many differences as similarities of the top-performing category beating ETFs in the first 15 weeks of 2022. Let’s take a closer look.


Salient observations:
- The seven best performers in each “class” of ETFs have posted YTD returns ranging from 6% to 60% as compared with -7.5% for SPY.
- XES, the top energy sector ETF, and XME, the top Basic Materials ETF are the two highest-performing ETFs in our sample. They also have the sample’s highest price volatilities and highest Betas. In each case, these numbers are even highest within their sector ETF categories. It stands to reason that outliers in performance on both sides during a period of one year or less would be high risk, concentrated, and narrow ETFs. XME, however, not only is the second top performer year-to-date in our sample but it is not the top performer for one-year, three-year, and five-year historical periods. This is unusually high persistence in performance for narrow single-industry ETFs. It is even more surprising given that its top holding is Peabody, a bituminous coal company. However, the ValuEngine model for year-ahead performance believes that FCG is in for a rough year with a rating of 1 (greatly underperform). On the other hand, the models believe that on a relative basis, XES, based on an equally weighted index of Oil Service and Equipment companies (e.g., Nextier, Halliburton, etc.), will continue to outperform SPY. These are tactical evaluations for the next six-to-twelve months, not recommendations for ETFs to hold long term.
- In general, all of the industry and sector ETFs led in performance by XES, XME, FEDX, FTXG, and IAK are tactical satellite ETFs that can be used to increase exposure to specific industry groups or sectors that an investor believes will continue to be favored by the prevailing macroeconomic and market environments. None would be recommended as core holdings for long-term investors. That said, each ETF and the group it represents is interesting in its own way.
- FEDX launched by Emles, a little-known provider in 2018, uses a customized index powered by an algorithm used to simulate an active management strategy to represent the aerospace and defense industries. The current geopolitical environment doubtlessly helped propel recent outperformance. ValuEngine rates FEDX to outperform SPY for the next six to 12 months.
- FXTG by First Trust uses an algorithmic “intelligent selection” index to select and weight food and beverage companies. Investor interest in these companies has risen because the demand for their products is perceived as inelastic and thus unaffected by price increases. Therefore, they are less negatively affected by spikes in inflation and scarcity of resources than companies in other industries. The ValuEngine model rating of 1 indicates that this recent relative surge may not continue.
- A brief aside – FEDX and FXTG are excellent examples of why many industry experts object to all non-actively managed products being called “passive.” They use intelligently designed algorithms to simulate active management strategies. Passive is more appropriately used to characterize one-dimensional weighting schemes and selection methodologies.
- IAK focuses on insurance companies, another industry perceived as having inelastic demand and very able to pass inflationary costs to its customers.
- In contrast to the ETFs listed above, FDL and DIVZ select their stocks from the entire US stock market and are not confined to a single economic sector. Both emphasize dividend-paying stocks with relatively low volatility that have classic value characteristics such as low price-to-book and/or price-to-earnings ratios. The key difference is that FDL uses an algorithmic index designed by Morningstar to select nearly 100 securities. DIVZ is actively managed, looking beyond the characteristics to evaluate and gain knowledge of each company it owns.
- There are well-documented problems that the top companies in SPY have had in maintaining their investor momentum despite positive earnings reports. The combinations of persistently rising inflation, supply chain, labor shortages, and brutal global conflict have been perceived by investors as sub-optimal for companies dependent on high earnings growth. In contrast, stocks with classic value characteristics in previously out-of-favor industries and sectors have benefited as the top S&P 500 companies have been used as sources of funds to buy value stocks.
- The fact that RSP, the equally weighted S&P 500 ETF has outperformed the cap-weighted S&P 500 ETF thus far this year also underscores the above trend. Since active managers tend to weight their stocks closer to an equally weighted scheme than a market-cap-weighted scheme, the fact that RSP is outperforming SPY by so much may be indicative to some investors that this may be an above-average time to siphon some funds from core index holdings into carefully selected actively managed ETFs.
Disclaimer: Always read the fact sheets and/or summary prospectus before buying any ETF. Past performance is not necessarily indicative of future results.


