
The short-term uptrend continues to point higher, and the PMO index has reached all the way to the top of its range. Rising prices are certainly good news, but with the PMO at this level, the best low-risk, short-term period for stock purchases has passed. It is now time to consider taking partial profits and to look for indications of the next short-term downtrend.

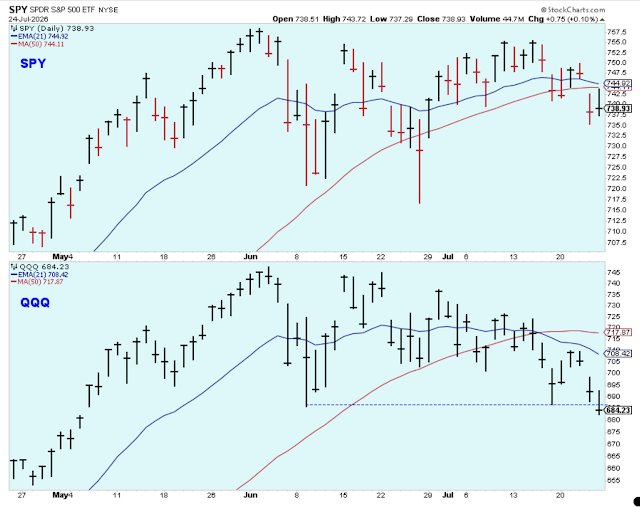
The chart below does a good job of showing the short-term trends. On Wednesday, it looked like the market might be ready to roll over, but after surprisingly strong sessions on Thursday and Friday, prices continue to point higher. There is some short-term resistance approaching the February highs, which is a likely spot to see the SPX start to struggle again.

The bullish percents of the two major indexes have risen bullishly near to the highs of their range similar to the PMO index. But with the bullish percents moving sideways for a few days and near their highs, it is another suggestion that it is time to look for the next short-term downtrend. A sharp dip below the 5-day averages of these bullish percents would help confirm the next short-term downtrend.

In contrast to the charts above, which suggest that prices might be ready to pause or change trend, the 10-day equity-only call-put ratio is pointing decisively higher - and there is nothing in the chart to suggest a change in the short-term uptrend. This is bullish.

Here is the same 10-day call-put chart but with a two-year time frame. After breaking above a critical level, it looks like it has plenty of room to run higher.

The major indexes moved above their 50-day averages this past week, which is the line in the sand indicating that the bulls have taken control of the market again, and that the bias for the larger trend is higher prices.
With the indexes above their 50-day averages, this means we have to reign in negative emotions and skepticism, and respect the action of prices. If and until these indexes move below their 50-day averages, the assumption is we will see a larger trend of higher prices despite shorter-term cycles up and down.

Despite the bullish charts shown above, there are some charts that still point to problems in this market, so we have to find the right balance between accepting the action of prices and the indications of market weakness.
The larger trend, as shown by the downtrend line of the junk bond ETF (JNK), continues to point lower. After a sharp rebound in mid-March, prices started moving lower again this past week, which is out-of-sync with the direction of stock prices.
In general, we want junk bond prices and stock prices to be moving in the same direction, so this junk bond weakness is a hint that the market isn't as strong as the charts shown above may suggest. I wouldn't make too much of this yet, but it is a bearish divergence that is worth watching.

The number of new 52-week lows dropped off dramatically from the highs in mid-March, which was a very bullish development, but the number of new lows has started to increase again and the number on Friday was way too high. Stock markets don't rally for very long when there are also a large number of new lows, and I don't like the combination of the PMO index at the highs while new 52-week lows are elevated.

Bottom Line: The indicators I follow are giving out mixed messages. This means that we assume higher prices, but we trade with a high level of caution. With the indicators in conflict, I suggest the thing to do is to fall back to the basic game plan, which is to take partial profits when the PMO is at the top of the range, and then wait patiently to re-deploy cash back into stocks when the PMO is near the bottom of the range.
Yields spiked higher on Friday, so it surprised everyone that stocks continued to push higher. There was a comment on CNBC that made some sense of both rising stocks and yields, but it completely surprised me.
It was suggested that investors are welcoming higher rates and yields because they feel the risk to the economy is high oil prices rather than a rising rate cycle. The idea being that higher rates will limit the advance of oil prices and avoid a recession, and all this favors stock prices. It's a bit convoluted for me, but interesting nonetheless.

Utilities have been very strong, and I usually think of a market led by Utilities as a bull market that is on its last legs. I'm just putting that out there.

Outlook Summary
- The short-term trend is up for stock prices as of March 14.
- The economy is at risk of recession as of March, 2022.
- The medium-term trend is down for treasury bond prices as of Jan. 3 (prices down, yields up).


Comments
Log in or sign up to join the conversation.