
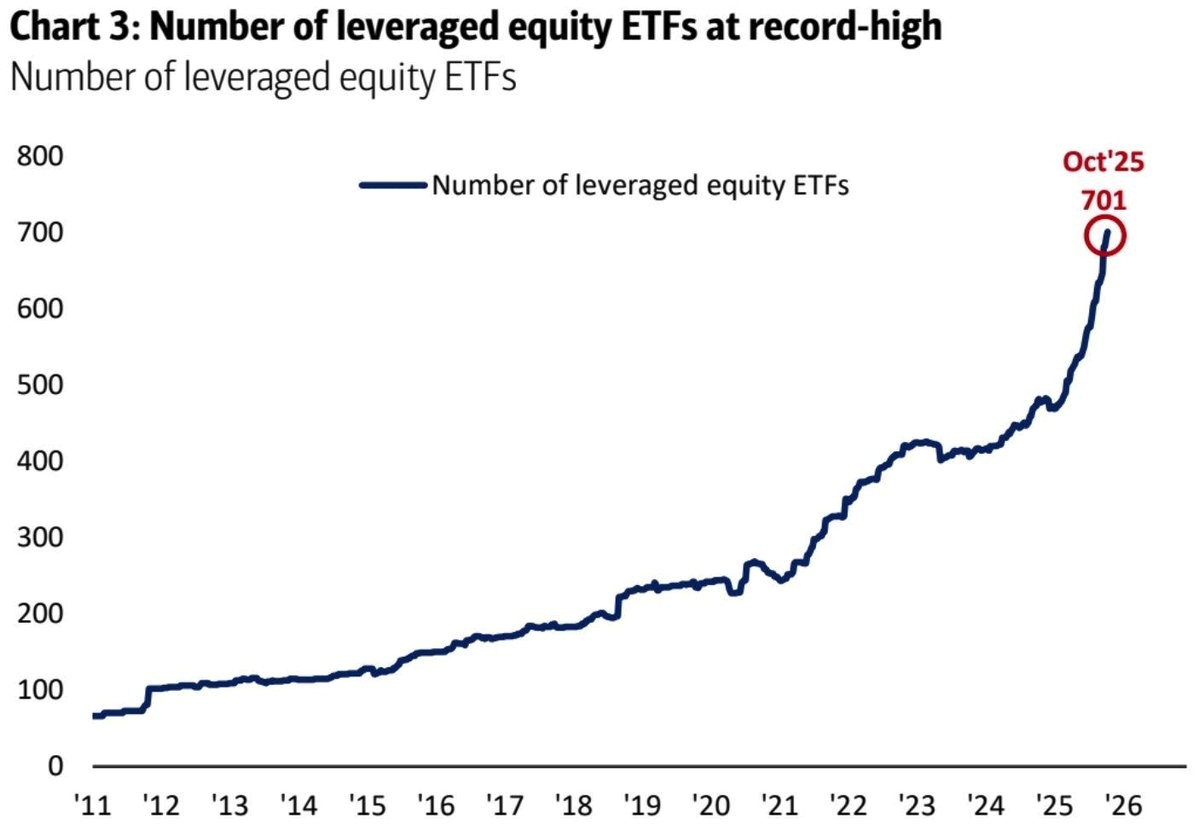
Not only is the market chasing the most speculative of assets, but it is employing record amounts of leverage to do so. Traditionally, investors use margin loans to gain leverage. More recently, however, leveraged ETFs allow investors to get leverage in one package. To wit, the graph below, courtesy of BofA, shows that there are over 700 leveraged ETFs. Most of these leveraged ETFs provide 2x or 3x the daily returns on an underlying index or individual stock. Further consider that Volatility Shares is offering 5x leveraged ETFs in single-name stocks and selected cryptocurrencies.
Leveraged ETFs reset daily. Which means the funds must buy or sell the underlying index to stay balanced. Further, the leverage combined with the daily resets means that rolling returns of the leveraged ETFs versus the underlying assets drift over time, especially in high volatility environments. The increased usage of leverage is not just a risk to those using the leverage, but it’s a broad market risk as well. For instance, leveraged ETFs chase the market. When the market is upward trending, leveraged ETF managers are forced buyers, thus they accentuate market gains. The opposite holds true in down markets. However, in a disorderly decline, undue selling pressure, partly from leveraged ETFs, can cause pockets of significant selling pressure. A one-off example occurred in the cryptocurrency market on October 11th, as we documented in our Commentary, The AltCoin Liquidity Bloodbath.
While the proliferation of leveraged ETFs is relatively new, Wall Street has a long history of creating complex leveraged products, which allow more access to leverage. For some astute traders, leveraged ETFs and other forms of leverage can be very profitable. However, as history has shown time and time again, retail traders ultimately pay the price by getting caught chasing markets when they peak.
What To Watch Today
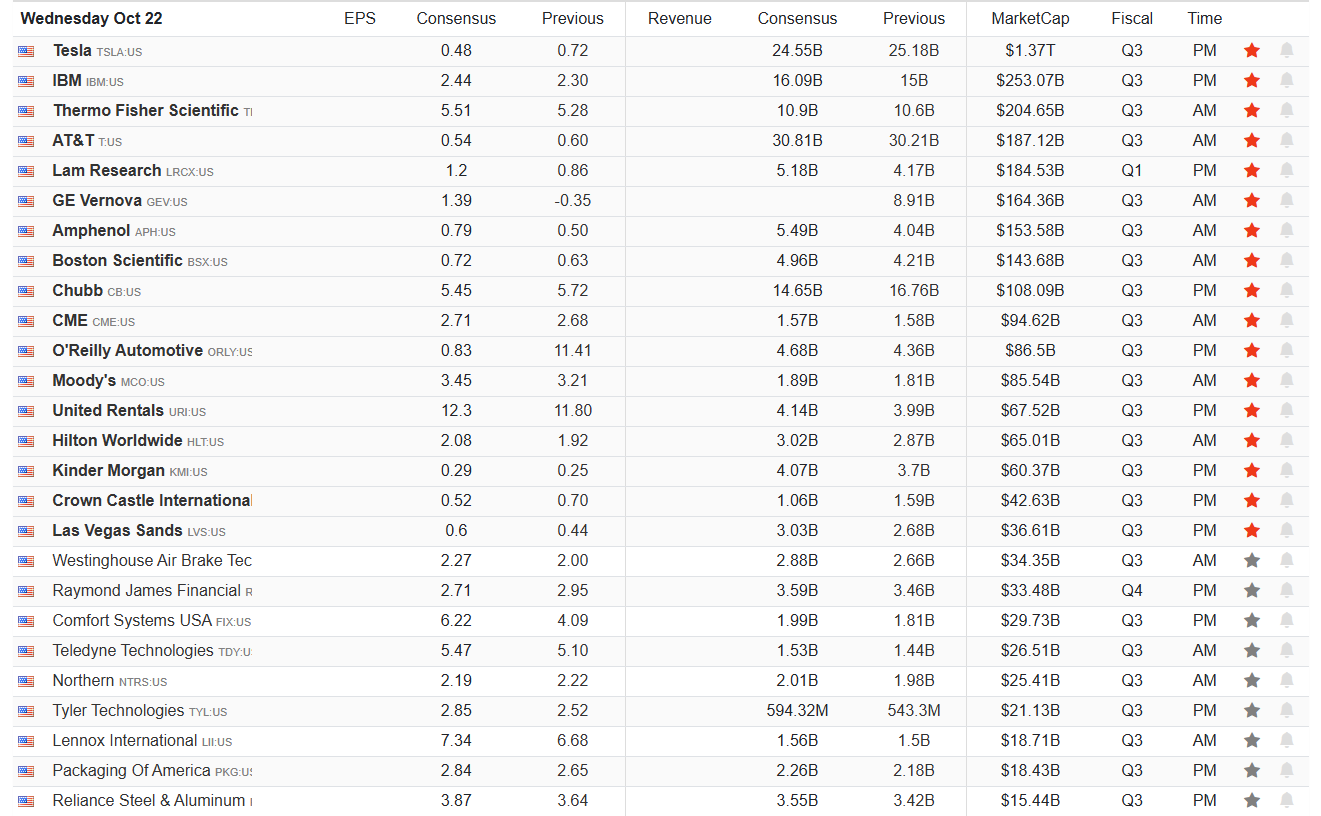
Earnings
(Click on image to enlarge)
Economy
- No notable economic reports
Market Trading Update
Yesterday, we discussed the market’s leverage buildup and its implications. While the market saw some volatility yesterday, we are about to hit the heart of earnings season over the next few days as most of the “Mag 7” will begin to report. While such should continue to put a bid under stocks, the speculative nature of the market remains extremely exuberant. Such was noted yesterday by Jason Zweig with some key stats to consider:
- SPACs are back. In 2025, more than 100 special-purpose acquisition companies have raised $21.9 billion combined. That’s the biggest crop of speculative “blank-check” companies since the SPAC boom of 2021, according to SPACInsider. That boom ended in a bust, incinerating more than $100 billion. But, hey, that was almost three whole years ago. Amnesia is Wall Street’s ambrosia.
- Meme stocks are back. Opendoor Technologies, the struggling online real-estate flipper, is up more than 360% this year, driven by an army of individuals buying the stock.
On Oct. 8, the Roundhill Meme Stock ETF, which buys stocks with “elevated trading volumes” and “social media momentum,” launched. It shot up almost 15% in its first six trading days (although it has since given up those gains). - AI mania is mushrooming. Companies like Oklo and Fermi, which are hoping to provide nuclear power to AI data centers, are some of this year’s hottest stocks—without any earnings and often without any revenue either.
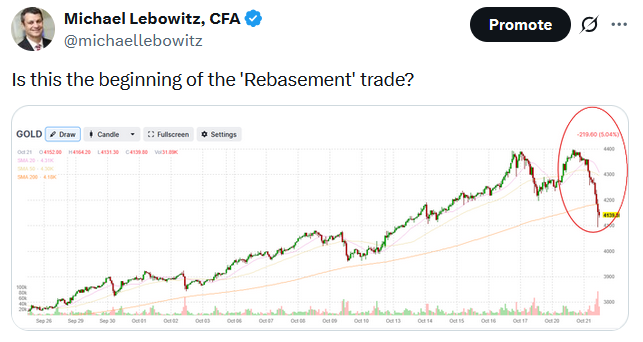
- Gold is white-hot. The yellow metal is up 12.9% in October and a glittering 64.9% for the year. Maybe it isn’t completely crazy, but it is unusual for the pet rock to turn into a moon rocket.. This time might be different, but in the past, gravity has always pulled gold back to the ground.
- Leverage is all the rage. In the burgeoning market for perpetual futures, cryptocurrency traders can magnify their gains 10-fold, 20-fold, even 100-fold—or, of course, be wiped out.
You thought ETFs that double or triple the daily gains or losses on single stocks and cryptocurrencies were extreme? A spate of new filings seeking Securities and Exchange Approval would quintuple the daily gains or losses on such stocks as Coinbase, Nvidia, Palantir, and Tesla—and cryptocurrencies like bitcoin, Solana, and XRP. If assets fall sharply in a single day, the ETF could go to zero.
As we noted yesterday, the market’s risk profile is near, if not already in, the euphoria stage. The thing about that is that momentum is tough to break, which means the market can defy logic for longer than you can imagine. The bullish trend remains firmly intact, but markets are very extended from long-term trends. Eventually, the mean-reversion will take place, but that warning falls on deaf ears amid the thunderous sound of the “herd” chasing asset prices higher.
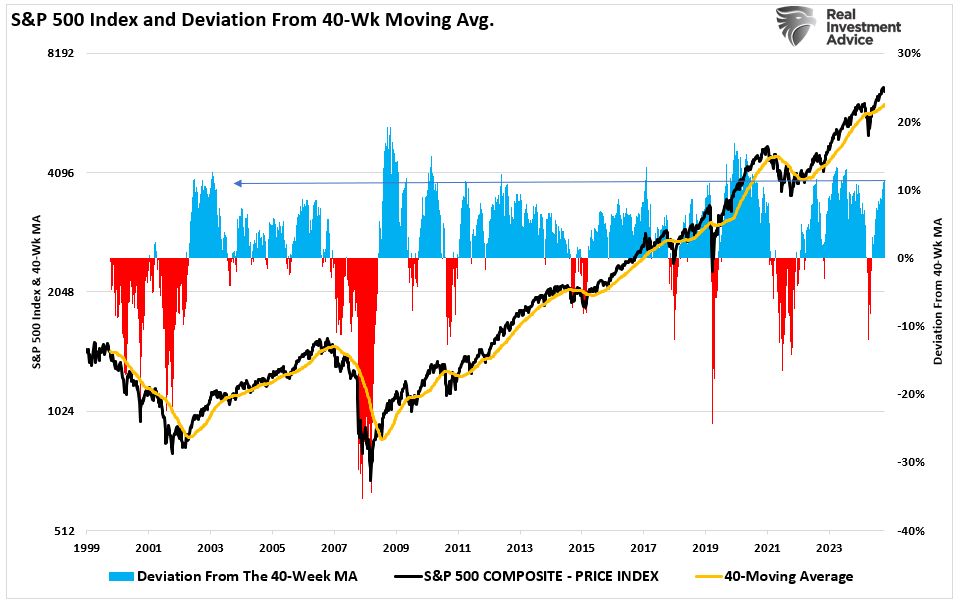
Below is a market chart versus the running trend using the 40-week moving average. The current deviation from that moving average is huge, suggesting that when the eventual reversion occurs, it will be equally as large. While such a reversion does not mean a “bear market” is coming, the correction will be large enough to deal some rather severe emotional damage, leading to investment mistakes.
We continue to stress the importance of risk management, even though there appears to be no risk in the market.
As Jason concluded:
“Playing with fire is fun—until it’s not. In the short run, a lot of people will make a lot of money. But most of them probably won’t keep it. In the long run, as the computer says at the end of the classic movie WarGames, “the only winning move is not to play.”
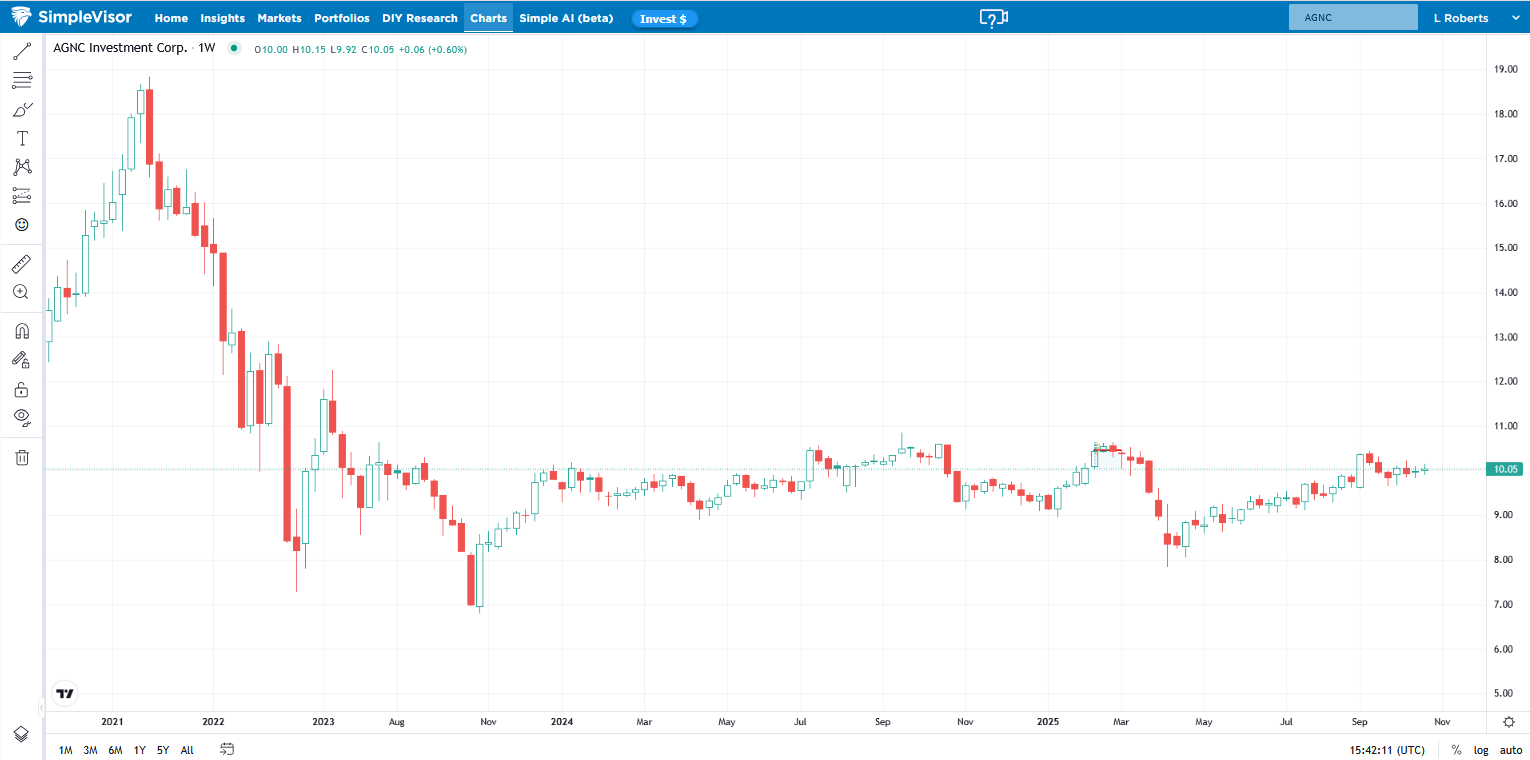
Deciphering Mortgage REIT Returns: AGNC (Part 1)
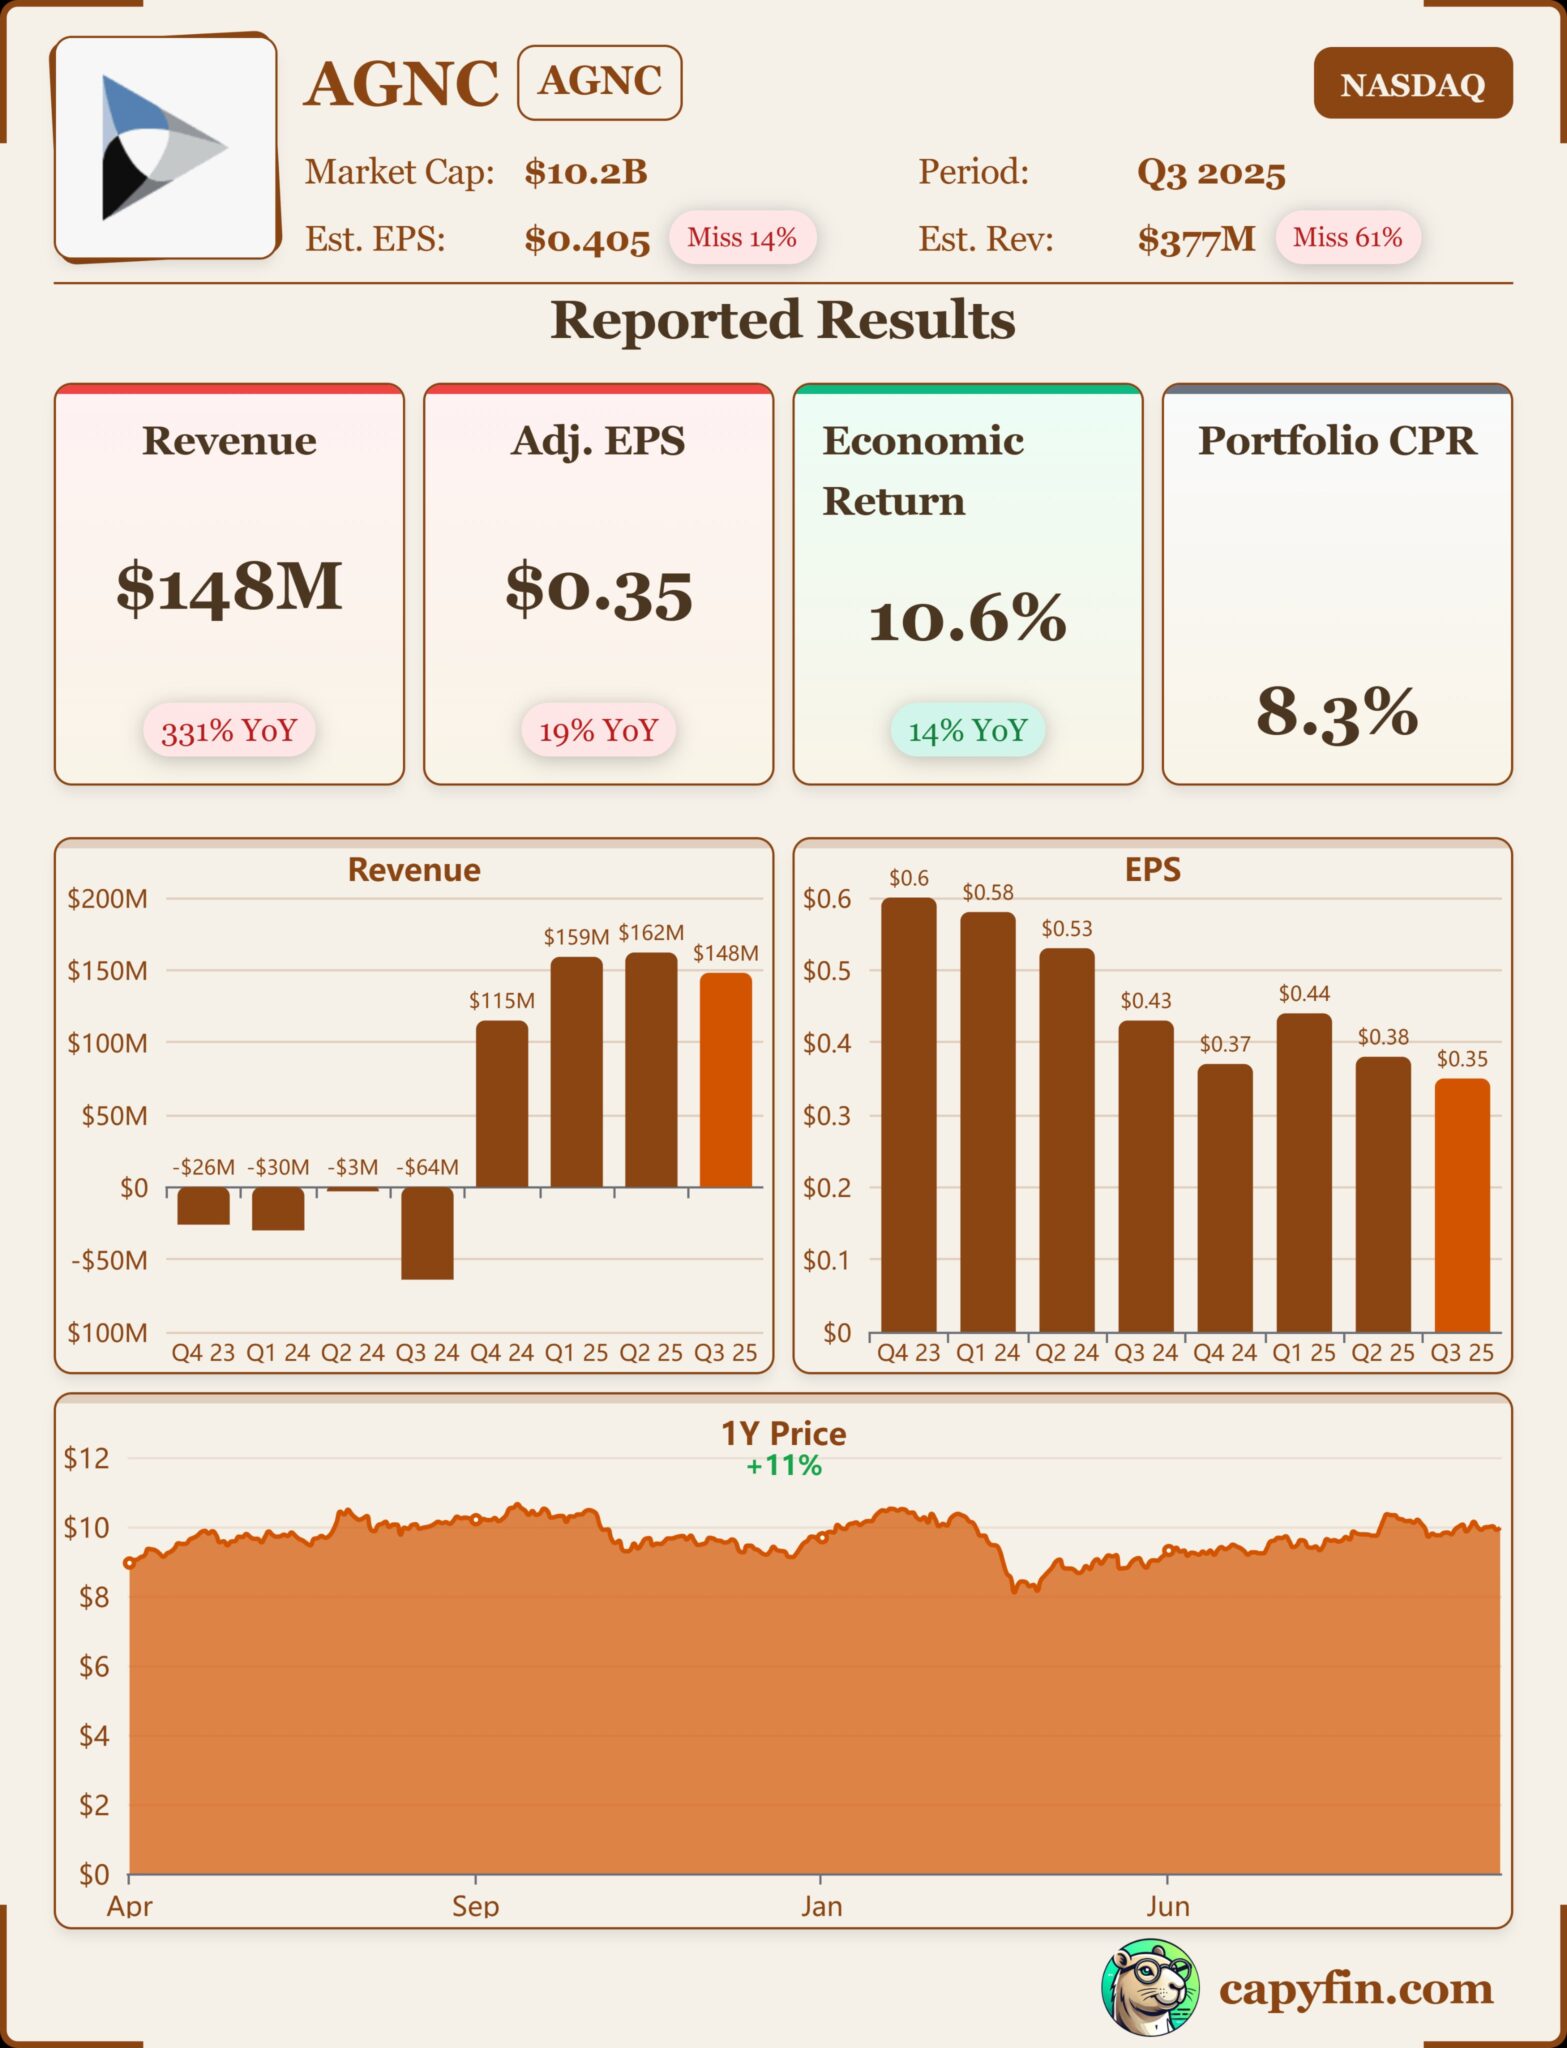
As we enter earnings season, we thought it would be helpful to provide a brief tutorial on how to decipher earnings for Real Estate Investment Trusts, or REITs. To accomplish this, we look at AGNC, a mortgage REIT (mREIT), which reported earnings on Tuesday morning. AGNC issues shares and borrows money to invest in government-guaranteed mortgage-backed securities. Thus, its assets do not have any credit risk, but due to the leverage and nature of their assets, they hold plenty of interest rate risk. Deciphering their earnings is about measuring the value and income potential of their portfolio of assets and liabilities.
As we share in the graphic below, AGNC missed its EPS estimates by 14% and revenues by 61%. For most stocks, this would likely have been accompanied by a poor stock performance. AGNC shares were essentially unchanged on the announcement. Let’s dig into their earnings to understand why EPS and Revenue are not the key financial indicators for mortgage REITs. More importantly, in the next section below, we explain what REIT investors should be focused on.
EPS and revenue can be very misleading due to non-cash items. Unlike banks and other financial institutions, AGNC is subject to mark-to-market accounting. This means unrealized gains and losses on their assets and hedging derivatives can significantly distort EPS. Thus, EPS and revenue figures are often more reflective of market conditions than operational performance.
Properly Analyzing REITs (Part 2)
Instead of EPS and Revenue, most REIT investors focus on dividend sustainability, book value per share, and economic return.
Dividend Sustainability:
- Refers to an mREIT’s ability to maintain or grow its dividend payments.
- How much free cash flow is available for dividends after operating expenses and debt costs?
- A sustainable dividend aligns with consistent cash flows.
Book Value per Share:
- Represents the net asset value of an mREIT divided by the number of outstanding shares.
- This ratio helps investors determine if they are paying a premium or a discount for the REIT’s portfolio.
- This figure can be misleading during the quarter because the price fluctuates, while the book value is reported quarterly.
Economic Return:
- Measures the total return to shareholders, combining dividend income and changes in book value per share.
- It captures both the income generated (dividends) and capital appreciation or depreciation (book value changes).
- A positive economic return indicates the mREIT is creating value for shareholders through income and asset growth.
As we share in the graphic for Part 1, AGNC provided an economic return of 10.6%. Its price-to-book value is 1.21%. The risk with a high price-to-book value is that the REIT is incentivized to issue shares and dilute current shareholders. Historically, the ratio ranges between .75 and 1.25%. AGNC has a dividend yield of 14.40% and has paid a consistent monthly dividend of $0.12 since April 2020.
Tweet of the Day
More By This Author:
Joe Weisenthal’s Take Down Of The ‘Debasement’ TradeSpeculative Bull Runs And The Value Of A Bearish Tilt
Rally Into Year-End: 3 Reasons To “Buy Dips”


Comments
Log in or sign up to join the conversation.