
Since the Pandemic, markets have been behaving abnormally. One such instance is a somewhat regular occurrence of bad market breadth. In other words, the market-cap weighted S&P 500 drives higher, yet fewer and fewer stocks are participating in the rally. For instance, in Monday’s Commentary, we discussed the current instance of bad breadth. To wit:
Market breadth has also narrowed, as shown, with fewer than 60% of S&P 500 stocks above their 50 and 200-day moving averages, highlighting the reliance on mega-cap technology to prop up index levels.
Given we have seen many instances of bad breadth over the last few years, it’s worth quantifying the number of cases before and after the pandemic. The graph below charts SPY on a logarithmic scale versus instances of bad breadth. Bad breadth is the 50-day return differential between the marketcap (SPY) and equal weighted (RSP) S&P 500, diverging two standard deviations from the norm. Between 2003 and the pandemic, there were 38 daily instances. All of these instances occurred between October and December of 2008, during the heart of the financial crisis. In 2020, there were 52 instances. Like 2008, the episodes of poor breadth accompany periods of high volatility. However, since 2020, there have been 95 instances. That is almost 3x the amount occurring in the 17 years prior to the pandemic. Moreover, many of the cases did not happen when markets were in disarray.
While bad breadth is certainly a warning today, we should be careful to appreciate that this warning has not been a great indicator recently.

What To Watch Today
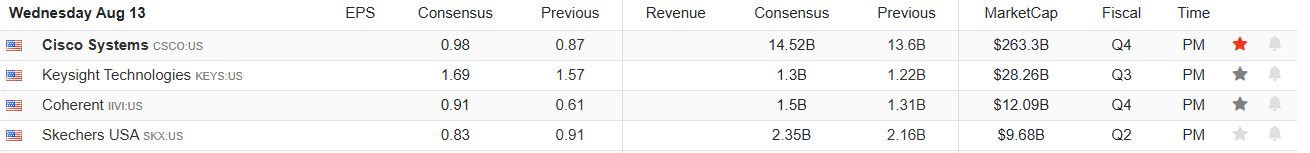
Earnings
(Click on image to enlarge)
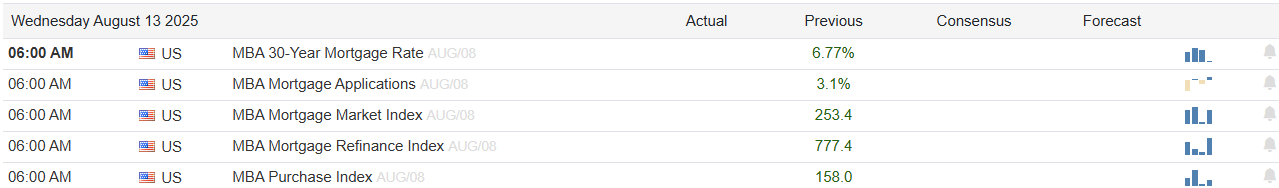
Economy
(Click on image to enlarge)
Market Trading Update
Yesterday’s commentary touched on the market’s breadth, participation, and inherent risk. However, following yesterday’s inline CPI report, markets rocketed higher on increased expectations of a Fed rate cut in September. The advance continued the recent “one step forward, one step backward” rally since last Friday and challenged all-time highs for the S&P 500. Notably, the market is also close to triggering a momentum “buy signal,” which could signal additional follow-through in the market should that occur.

So far, the market has continued defying the odds of a seasonally weak period, but that does not mean all risks have been resolved. As shown, money flows remain weak, and relative strength has a negative divergence. If the market can break out to new highs with an increase in money flows and an improvement in relative strength, then the rally could have legs for a further advance. However, for now, this is still a rally within a consolidation market pattern.
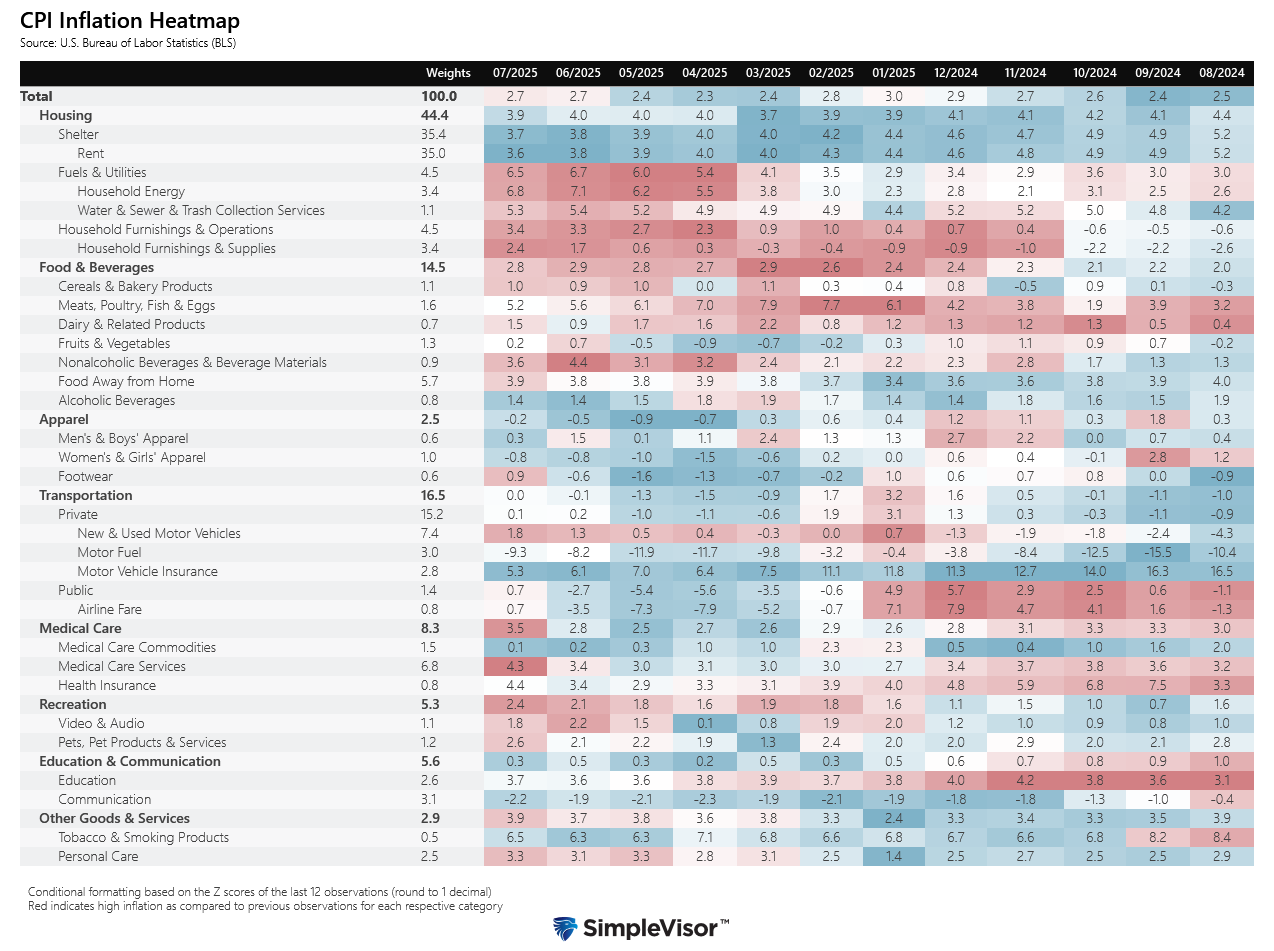
CPI Comes In As Expected
CPI rose 0.2% as expected, keeping the year-over-year rate at 2.7%. Simply, it was just right, not too hot, not too cold. While the annualized monthly rate is 2.4% and above the Fed’s target, the latest round of data should ease the Fed’s concern that tariffs are highly inflationary. The table below breaks out inflation by its broader categories and weighting. Shelter and rents continue to cool slowly, which is offsetting some pressure from items that carry much lesser weights. For instance, footwear rose 0.9% last month after declining in the prior months. However, the 0.1% decline in shelter prices offset the rise in footwear by a factor of 4.
It’s possible the price hike in footwear due to tariffs is a one-time, and not persistent, increase. For example, if there is a new 10% tariff on an item and it’s passed through entirely to the consumer, prices should rise by 10%. However, that 10% increase will occur when the tariff takes effect. Thus, the price change in the following months will likely revert to its prior changes. Moreover, with higher prices, some consumers may negatively impact demand by delaying purchases or buying a different, lower-cost item. As a result, companies that hiked prices due to tariffs may need to reduce prices after the tariff. In some instances, we may see disinflation or deflation after a bump up in prices.
The Benefits Of Working With An Individual RIA Versus A Big Bank
When it comes to your financial future, choosing the right advisor matters. But not all financial advisors operate the same way. One of the most important distinctions you can make is between a Registered Investment Advisor (RIA) and an advisor at a big bank or brokerage firm.
At first glance, both may offer similar services such as portfolio management, financial planning, retirement strategies, but the underlying philosophies and incentives often couldn’t be more different. If you’re comparing options, understanding the differences between an independent RIA vs big bank advisor can help you make a more informed, confident decision.
Tweet of the Day

More By This Author:
A 50 BPS Rate Cut Is Not Out Of The QuestionMeme Stock Trading & Livermore’s Approach To Speculation
Auto Manufacturing Shift Puts Pressure On Profits


Comments
Log in or sign up to join the conversation.