How The S&P 500 Reacts To The Mysterious Dance Of The 10-Year Yield
Image Source: Unsplash
Watch the free-preview video extracted from the WLGC session before the market open on 16 Apr 2024 below to find out the following:
- How does the 10-year yield impact the behavior of the S&P 500, particularly during a market correction
- The downside target for the S&P 500 should the 10-year yield test the previous high
- Under what circumstances could the 10-year yield be used as a leading indicator?
- And a lot more...
Video Length: 00:04:50
Market Environment
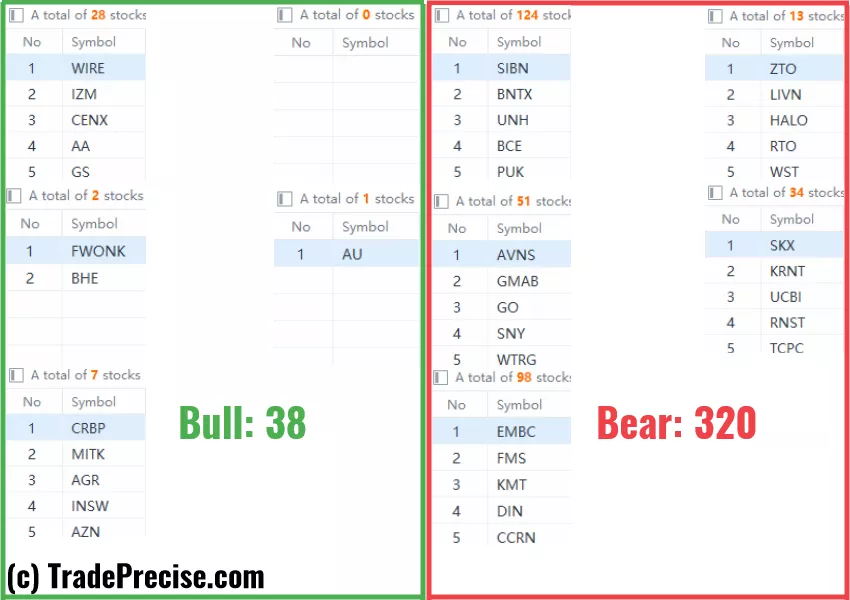
The bullish vs. bearish setup is 38 to 320 from the screenshot of my stock screener below.
There is a significant change in the market and there is only 1 quality long entry setup and many of the short entry setup with the leveraged ETF and the underlying.

The market was spooked by the inflation and this was discussed during last week’s session.
Below is this 2-min video - 2-Year Yield Futures Surge Spells Trouble
Video Length: 00:01:56
Market Comment
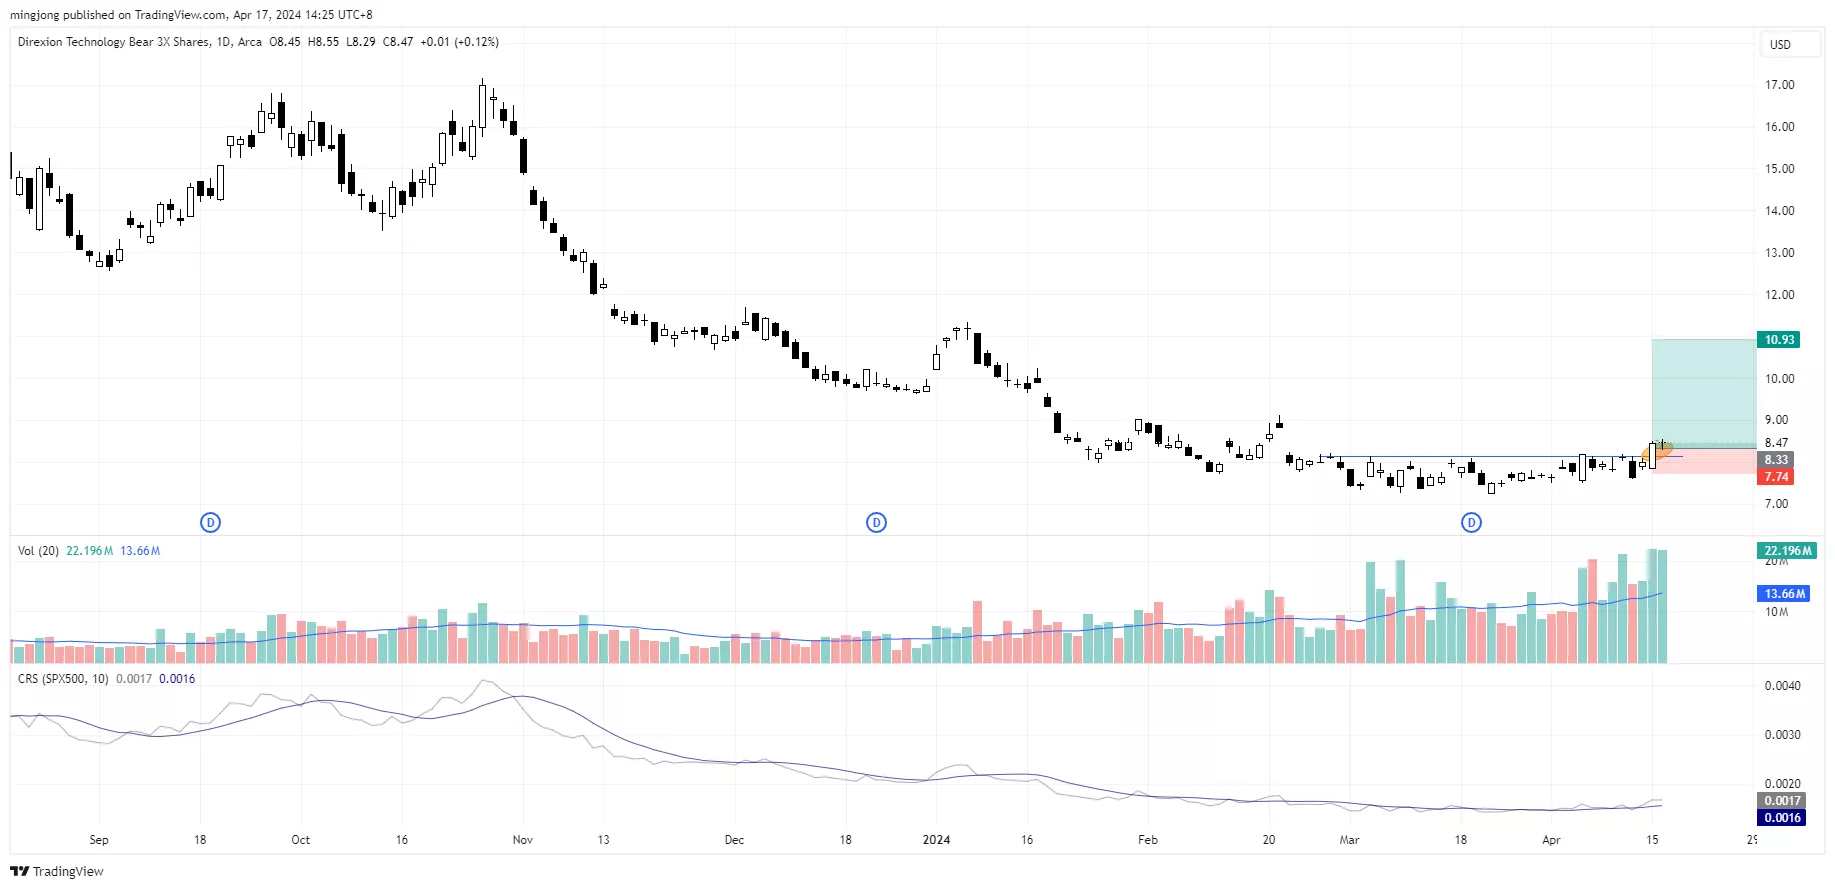
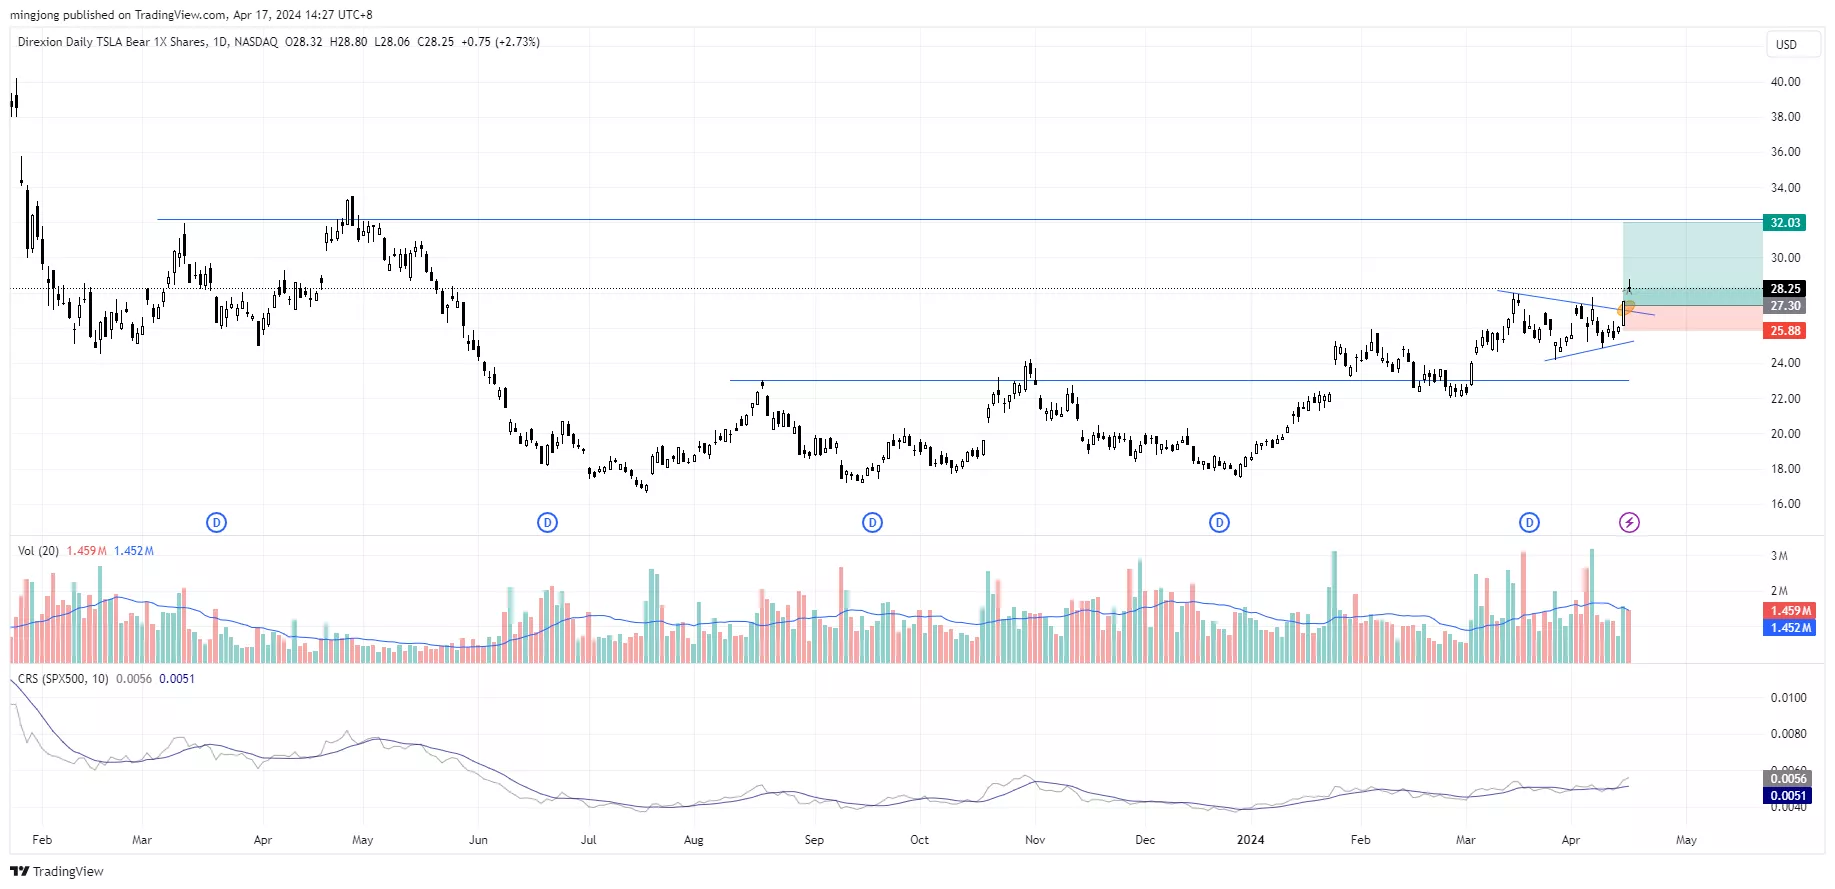
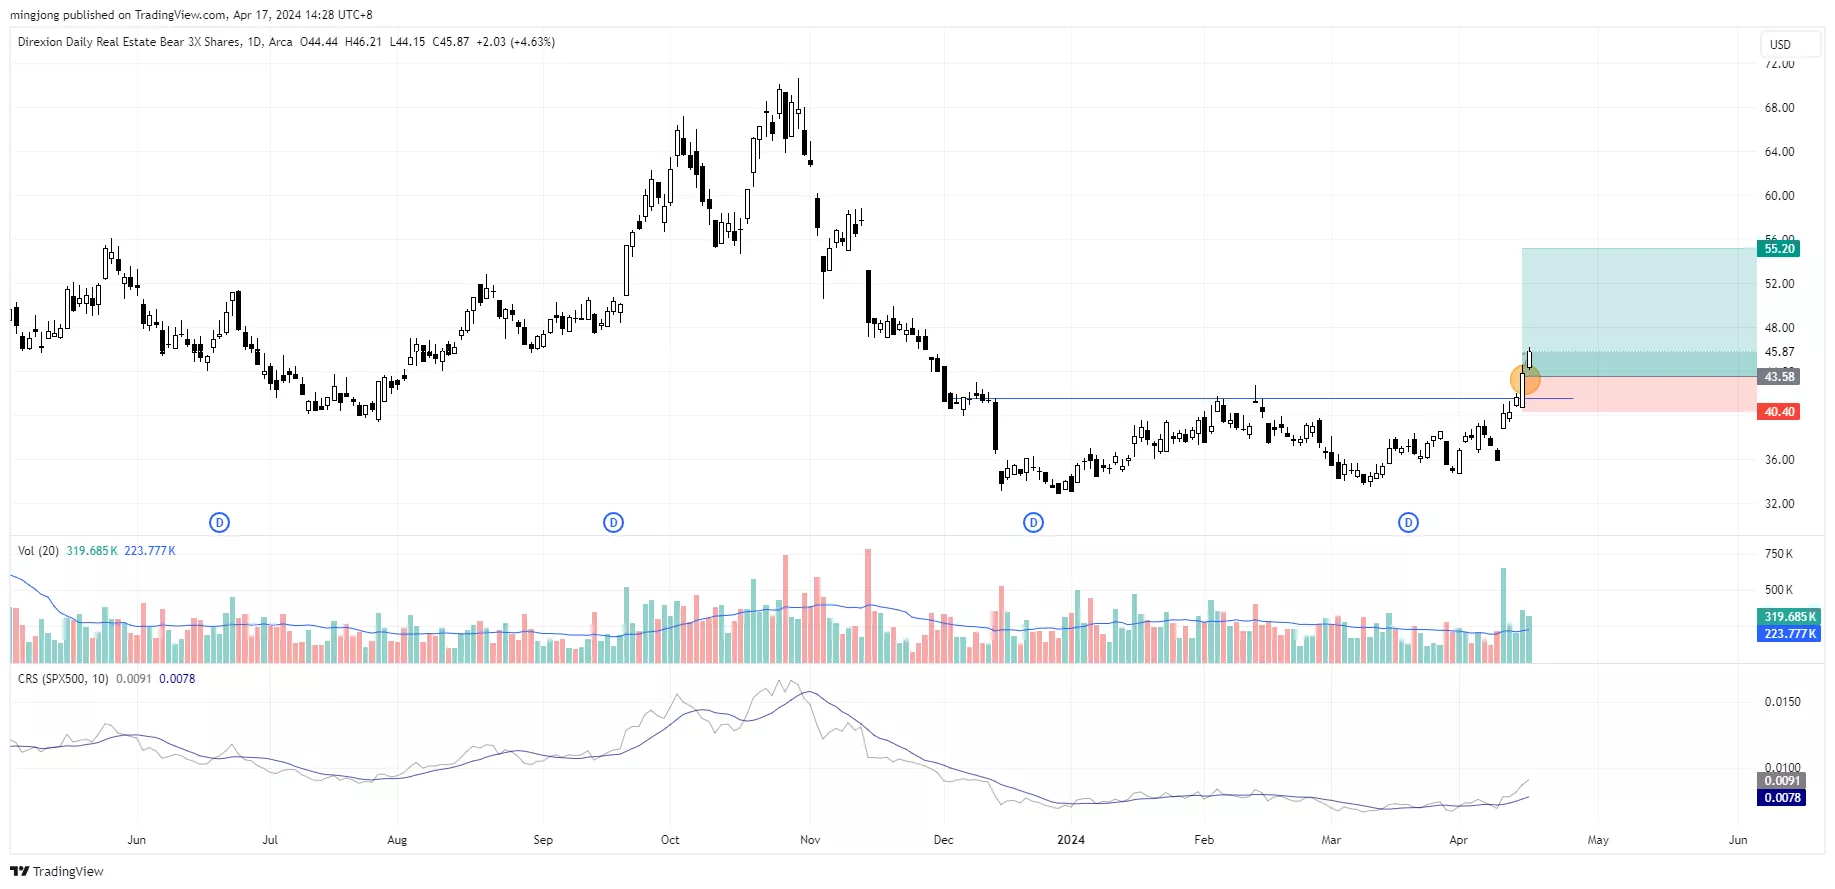
1 “low-hanging fruits” TECS (XLK Bear 3X) trade entries setup + 11 actionable setups DRV (XLRE Bear 3X), TSLS (TSLA Bear) have been discussed in the special paid episode (1:27:54) accessed by subscribing members.
(Click on image to enlarge)

(Click on image to enlarge)

(Click on image to enlarge)

More By This Author:
Is The Bull Run Nearing Its End? This Is What You Could Do
This Demand Zone In S&P 500 Needs To Hold
Crude Oil Poised For Bullish Breakout From Wyckoff Accumulation Pattern
Disclaimer: The information in this presentation is solely for educational purpose and should not be taken as investment advice.


