
Entering Q4 With Mix Of Optimism And Caution Suggests Hedged Long Positioning
I mentioned early last month that it had been quite a long stretch since the market had seen even a -5% correction, but we finally got it, with the S&P 500 falling -6% (intraday). Although many commentators (including myself) felt we needed even more of a correction in the major market indexes to really wring out some excesses and the “weak” holders, the underlying internals tell a different story of a much harsher “stealth” correction. Alpine Macro reported that 90% of the stocks in the S&P 500 have fallen at least -10% from their recent highs, with an average decline of -17% … and -38% in the Nasdaq Composite! A casual observer might not have noticed this since these individual stock corrections didn’t occur all at once, but rather in more of a rolling fashion as various industries fell in and out of favor at different times. The masking by the major indexes of these underlying corrections is the magic of passive index investing, as the diversification limits downside (albeit upside as well, of course).
Moreover, while the cap-weighted indexes have surged to new highs as recently as early September, the equal-weight and small-cap indexes have been trading sideways since March. Regardless, investors took the September correction as a buyable dip. Last Thursday-Friday provided two bullish breakout gaps, and in fact, Thursday was the strongest day for the S&P 500 since March. Looking ahead, the question is whether the rapid 2-day surge is sustainable, or if there is some technical consolidation (aka “backing & filling”) to be done – or perhaps something much worse, as several prominent Wall Street veterans have predicted.
No doubt, economic challenges abound. Energy prices are surging. COVID persists in much of the world, especially emerging markets, which is at least partly responsible for the persistent supply chain issues and labor shortages in the manufacturing and transportation segments that are proving slow to resolve. Retail and restaurant industries continue to have difficulty filling jobs (and they are seeing a high rate of “quits”). And now we are seeing fiscal and monetary tightening in China – likely leading to lower GDP growth (if not a “hard landing”) – due to long-festering financial leverage and “shadow banking” finally coming to roost (witness the Evergrande property development debacle, and now it appears developer Modern Land is next). Indeed, we see many similarities with Q4 2018 (including the S&P 500 price chart), when the market endured a nasty selloff. Investors should be mindful of these risks. So, although TINA-minded (“there is no alternative”) equity investors continue to pour money into stocks, and an exuberant FOMO (“fear of missing out”) melt-up is possible going into year-end, there likely will be elevated volatility.
I write in greater depth about oil prices and China’s troubles in this article.
Q3 earnings reporting season is now underway, and I expect the number and magnitude of upside surprises and forward guidance will determine the next directional trend. In any case, we continue to like the Energy sector, even after its recent run (in fact, you will find a couple of oil exploration & production firms in the new Baker’s Dozen coming out this week). Wall Street estimates in the sector still appear to be too low based on projected prices, and the dividend yields are attractive. Sabrient’s SectorCast ETF rankings continue to show Energy at or near the top. Actually, from a broader perspective, the “deep cyclical” sectors (especially Energy, Materials, and Industrials), with their more volatile revenue streams but relatively fixed (albeit high) cost structure (and high earnings leverage), remain well-positioned to show strong sales growth and, by extension, upside earnings surprises.
In this periodic update, I provide a comprehensive market commentary, offer my technical analysis of the S&P 500 chart, review Sabrient’s latest fundamentals-based SectorCast quant rankings of the ten US business sectors, and serve up some actionable ETF trading ideas. To summarize, our SectorCast rankings reflect a solidly bullish bias; the technical picture is somewhat mixed, and our sector rotation model has regained its bullish posture (pending technical confirmation early this week).
Commentary:
In Q2 2021, the Atlanta Fed GDPNow estimate started the quarter at +13.5% and ended at +6.5%. As things turned out for Q2, the final number from the BEA came in at an annual rate of +6.7%, following a Q1 reading of +6.3%. Moreover, adjusted real Gross Output (GO), which includes all economic activity across the supply chain rather than just final spending (GDP), grew at an annualized rate of +7.4%. (Note: when GO rises faster than GDP, it suggests that economic growth is accelerating.) Notably, GO reached $50 trillion for the first time in Q2, while GDP was $22.7 trillion. Looking ahead, Q3 estimates from the Atlanta Fed GDPNow model started at +6.0, rose slightly to +6.3%, and now has fallen to +1.2% (as of 10/15/21). We will soon see where Q3 GDP ultimately lands – and its impact on corporate earnings growth and forward guidance.
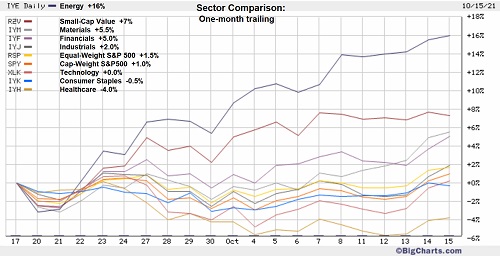
The Energy sector has been on fire (no pun intended). As a result, capital flows have surged into Energy ETFs. And not to be outdone, Financials, Industrials, and Materials also have joined the party as a cohort of cyclical sectors, as shown in the chart below. This is indicative of increased market breadth. Hopefully, this will continue, which I believe is necessary for the market to make new highs.
Notably, the big banks reported stunning financial results last week. Financials benefit from the steeper yield curve, as longer-term yields have crept higher while shorter-term yields remain moored by the Fed. However, as the 10-year yield has reached the 1.6% handle, I believe it will entice investors to add duration exposure (i.e., buy longer-term bonds), which also puts a bid under the US dollar. Moreover, I agree with First Trust’s assessment that the Fed is unlikely to signal any change in their plans to keep short-term rates near zero for the foreseeable future, and that the Fed is likely to begin tapering asset purchases in November – but without a “taper tantrum" market reaction (i.e., a bond selloff) like what occurred in 2013.
I have written in great detail in my July and September posts about inflation and my view that inflationary pressures likely will moderate in 2022 as supply chain issues continue to resolve, labor returns to work, velocity of money stock remains low, the dollar retains strength as a global safe haven, and capacity utilization stays below the worrisome threshold, plus the long-term secular trends of aging demographics, slowing global population growth, re-globalization of trade and supply chains, and the unstoppable force of disruptive innovation.
But regardless of whether we have real monetary inflation or simply the lingering effects of transitory supply disruptions, keep in mind that inflation doesn’t kill economic growth on its own; rather it is rising interest rates (aka borrowing costs), which are not likely to come any time soon. And the ratio of interest payments on debt by the federal government to its total spending is historically low.
Oil prices:
Let me talk more about Energy, given its prominence in the news these days with supply shortages around the world and surging prices of oil, natural gas, and gasoline, with NYMEX WTI crude oil November futures surging above $82 on Friday – and some experts are telling us to expect oil prices above $100 a barrel by next year. I have argued in the past that oil would likely remain in the $40-80 range for years to come, mostly due to new technologies for tapping into formerly uneconomic hydrocarbon formations (such as fracking, directional drilling, and enhanced recovery techniques) and the industry’s ability to quickly ramp up production from proved reserves. But the political pressure to reduce oil consumption, partly by hindering new production and distribution, has proven too powerful of a force. Although North America has the proven hydrocarbon resources to be energy independent, we no longer have the will to produce and distribute it. Witness the onerous environmental protection mandates and the canceled Keystone XL Pipeline.
In addition, shareholder worries about the long-term outlook for oil has led them to pressure oil companies to reduce Capex and raise dividends. As production from existing wells falls over time, it requires continual maintenance and new drilling, but the number of active rigs is about 60% below 2018 levels despite the allure of surging oil prices. And for its part, OPEC recently announced only a limited production increase.
According to independent research firm Alpine Macro, due to lesser reliability, higher storage cost, and lower energy efficiency, alternative sources of electricity always require fossil fuels as a backup. They write,
“The current energy crises in China and Europe highlight the continuing need for fossil fuels despite global efforts to decarbonize. [Thus,] it is wrong to think that renewable energy will entirely replace fossil-fuel based energy sources soon. In fact, renewables are only able to meet the net increases in power demand for major countries, while existing energy demand will continue to be met by fossil fuels. This situation will remain for many decades to come.” Moreover, according to Alpine Macro, “European governments have shut down the most energy-efficient source of electricity [e.g., nuclear], while promoting the less efficient sources of power supply [e.g., wind and solar].This is counter-productive to fighting climate change.”
China’s troubles:
At a forward P/E of about 21x for the S&P 500, many market commentators believe that stocks are priced for perfection in the face of slowing global growth and a less accommodative Fed. Nevertheless, the US still enjoys positive economic growth and higher interest rates than the rest of the developed world and continues to attract foreign capital, which keeps Treasury yields relatively low and the US dollar strong. Still, many investors may be concerned about falling Q3 earnings estimates and GDP growth forecasts, which are largely due to news reports about financial troubles in China, despite its opacity and tight control of the media. So, let’s talk about China.
I began discussing back in 2015 the threats to the global economy of China’s highly leveraged and opaque financial system. That was right around the time of China’s summer stock market crash and currency devaluation. In September 2018, following escalation of Trump’s trade war with China, I wrote in-depth about these issues, including its house-of-cards debt and its “growth at any cost” approach of targeting GDP growth, which led to massive (and unnecessary) infrastructure projects like the proverbial bridges-to-nowhere, vast cities that no one lived in, and high-speed bullet trains with few riders. Today, there are upwards of 60 million empty apartments in China held as “savings accounts,” as it is common among Chinese investors to store money in real estate (often prepaid in advance of construction). They apparently hold more savings in real estate than stocks. And strikingly, something like $50 trillion of real estate value (assuming you can even put real value on so much illiquid assets) is the collateral backing the entire financial system. All of this is why the country began looking beyond its borders, e.g., the Belt & Road Initiative, which is also stalling out as “too much, too fast” for most of the indebted countries.
Now suddenly many of us are learning for the first time about the massive property developer, Evergrande. Talk about creative accounting; it appears that repurchase agreements (aka repos) used as loan collateral were booked as sales. New government restrictions to crush a rampant speculative bubble has been a big problem for highly leveraged developers, as real estate constitutes around 28% of the Chinese economy. With over $300 billion in total debt, and massive interest payments past due that it cannot make without taking on more debt (i.e., classic Ponzi financing, which is the third stage of economist Hyman Minsky’s Financial Instability Hypothesis), default seems imminent, which would be disastrous – and perhaps the first domino to drop – which the CCP likely will not allow to happen. Although the CBOC prefers to keep the growth of money supply below the GDP growth rate, their fiat currency system is like ours (i.e., not backed by gold; in fact, it is pegged to the US dollar), so they can choose a resumption in monetary easing (i.e., print money) to bail it out – and they may have no other choice. Unfortunately, China already holds nearly $50 trillion in total debt, at a debt-to-GDP ratio of 335%.
Because China has been the primary engine of global growth for several years now, any significant slowing of growth will inevitably result in a slowdown for the rest of the world, including the US. Nevertheless, China always seems to be able to magically pull a rabbit out of its hat, just in time.
But there is a bigger perspective at play here. Because of this bind China finds itself in, Chairman Xi’s impulse has been to tighten his grip on the free marketplace. It reminds me that the school of thought in the West in justifying its support of China’s rapid rise has been that greater prosperity would lead to greater freedom there. But that simply hasn’t happened. Instead, its objective is global economic, military, and technological hegemony … and to demonstrate the superiority of an authoritarian system.
I’d like to share something that helped solidify my confidence both in America and in the amazing potential of blockchain technology (and cryptocurrencies). Eric Peters of One River Capital (which runs portfolios tied to inflation, volatility, and digital assets) has opined on the CCP’s criminalization of cryptocurrency transactions and the creation of a digital yuan, with the goal of creating an alternative to the US dollar as a parallel international payments system. However, as Peters points out,
“The US dollar is the world’s reserve currency. 59.2% of all official foreign exchange reserves are held as US dollars (totaling about $7.1 trillion) … 2.6% are Chinese renminbi (about $312 billion) … Some reserves are held in gold. Someday, there will be digital asset reserves too.” Moreover, Peters explains, “… the free market has already created parallel systems that lay outside of Beijing’s dominion [like bitcoin, ether, and stablecoin] … China success in the digital currency arena hinges on control – the digital yuan will be used by decree. US success depends on regulators integrating US dollar stablecoin into the mainstream. They will. And when they do, these technologies will come under conventional oversight, unlocking exponential growth. Benefits will accrue to the nation with the currency that the market selects. That remains, unambiguously, the US.”
Hear, hear.
Final comments:
Market maven Alexander Green has opined, “The greatest threat to this long-running bull market is not a tightening Fed, higher valuations or moderating corporate profits. It's the growing clamor for regulatory and redistributive policies that will reduce innovation, lessen productivity and undermine the economy.”I still believe we are witnessing a “Roaring ‘20s redux” from 100 years ago, with a more modest inflationary climate than many are forecasting and an extended expansionary economic cycle – so long as our political leaders don’t screw it up.
So, overall, I would suggest staying invested in equities, but hedged. I continue to suggest being balanced between both value/cyclicals and secular growth stocks, but with a greater focus on quality as we move past the exuberant speculative recovery phase. After all, earnings are robust, interest rates are low, IG and HY credit spreads are tight, and total global debt paying negative yields remains near $15 trillion. In fact, those who have owned risk-free 10-year Treasury notes over the past 12 months have lost -11% of their real purchasing power as bond prices fell while inflation rose, while those owning IG corporate bonds lost nearly -5%. (So much for a comfortable retirement!) Defensive investors might prefer overweighting large-cap, secular-growth Tech and high-quality dividend payers, and perhaps REITs (for real estate exposure and income) and TIPS (for duration exposure). Hedges might be found in inverse ETFs, out-of-the-money index put options, gold, and cryptocurrencies (especially now that the SEC has signaled its intention to bless bitcoin futures ETFs). I am personally holding all of these hedges.
Keep in mind that some pundits have suggested that a broad market correction has already been in progress but has been disguised by the internal capital rotation into mega-cap growth stocks since June. This is reminiscent of the summer of 2018, driven by escalation in the trade war with China, which of course culminated in the Q4 2018 selloff. I discuss the similarities of the chart formation below, but the message is to be prepared for more volatility. Keep in mind, something like 70% or more of trading volume is driven by algorithmic trading, and these firms tend to take money off the table (and thus overall market liquidity falls) as the CBOE Volatility Index (VIX) rises, which would exacerbate any sharp selloff. So, please be mindful of elevated downside risk.
SPY Chart Review:
The SPDR S&P 500 Trust (SPY) closed Friday just below 446. As I mentioned last month, there had been quite a long stretch without a 5% correction, which we finally got, but there still hasn’t been a test of support at the 200-day simple moving average (SMA) since June 2020 (during the initial pandemic recovery). After seven successful tests of the 50-day SMA this year, each time reversing to achieve a new high, September finally brought about a failed test of support, but it held the 100-day by its fingernails, as shown below, and has now formed two impressive bullish gaps in succession on Thursday and Friday. Thursday closed right on the 50-day SMA, and Friday broke out strongly above, creating what might be interpreted as a bullish “reverse head & shoulder pattern,” with a target just above the all-time high. On the other hand, SPY may well turn back down to retest the 50-day or even fill those two big gaps, which will serve as magnets for price action unless there is a continued surge in investor optimism and bullish conviction.
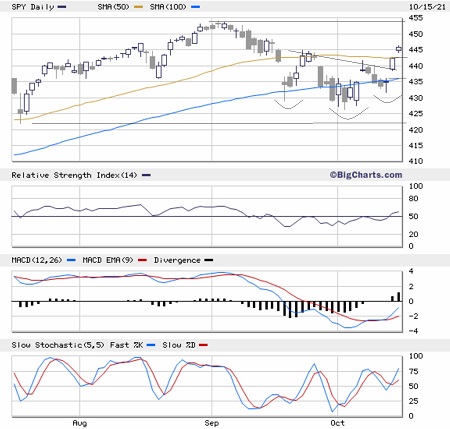
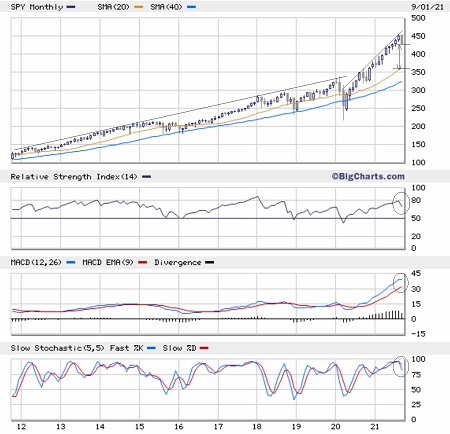
A chart of the CBOE Volatility Index (VIX) also shows two big bearish gaps (VIX typically moves opposite SPY), and Friday showed a bullish (bearish for SPY) hammer candlestick pattern. In addition, if you pull up a 10-year monthly chart of SPY, as shown below, you can see the striking parabolic move and how ominously stretched from its 50-month SMA it has become, and oscillators RSI, MACD, and Slow Stochastics are all pointing down from overbought territory. This situation can go on longer, of course, but the gap will eventually close.
And here’s another word of warning. The recent price action for SPY is shaping up suspiciously like Q4 2018 when the market sold off mostly due to fears that the trade war with China would slow the global economy. Similarly, current action was timed with the Evergrande situation and evidence of China tightening the liquidity spigot and pumping the brakes on growth to derisk its shaky financial system. The September selloff from all-time highs this year looks much like the October selloff in 2018, and the current October bounce looks a lot like the initial November bounce back then, which of course led to the harsh December correction. A similar outcome is not my expectation given the strength of corporate earnings and accommodative Fed, but investors should be mindful of the set up.
Latest Sector Rankings:
Relative sector rankings are based on our proprietary SectorCast model, which builds a composite profile of each of over 1,000 equity ETFs based on bottom-up aggregate scoring of the constituent stocks. The Outlook Score employs a forward-looking, fundamentals-based multifactor algorithm considering forward valuation, historical and projected earnings growth, the dynamics of Wall Street analysts’ consensus earnings estimates and recent revisions (up or down), quality, and sustainability of reported earnings, and various return ratios. It helps us predict relative performance over the next 2-6 months.
In addition, SectorCast computes a Bull Score and Bear Score for each ETF based on recent price behavior of the constituent stocks on particularly strong and weak market days. A high Bull score indicates that stocks within the ETF recently have tended toward relative outperformance when the market is strong, while a high Bear score indicates that stocks within the ETF have tended to hold up relatively well (i.e., safe havens) when the market is weak.
Outlook score is forward-looking while Bull and Bear are backward-looking. As a group, these three scores can be helpful for positioning a portfolio for a given set of anticipated market conditions. Of course, each ETF holds a unique portfolio of stocks and position weights, so the sectors represented will score differently depending upon which set of ETFs is used. We use the iShares that represent the ten major U.S. business sectors: Financial (IYF), Technology (IYW), Industrial (IYJ), Healthcare (IYH), Consumer Goods (IYK), Consumer Services (IYC), Energy (IYE), Basic Materials (IYM), Telecommunications (IYZ), and Utilities (IDU). Whereas the Select Sector SPDRs only contain stocks from the S&P 500 large cap index, I prefer the iShares for their larger universe and broader diversity.
Here are some of my observations on this week’s scores:
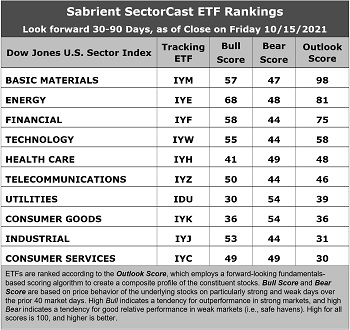
1. The rankings continue to look bullish, topped by deep cyclicals Basic Materials and Energy with impressive Outlook scores of 98 and 81, respectively. You would expect strength in cyclical sectors given their high earnings leverage within an expansionary economy and solid oil and commodity prices. Basic Materials displays the best analyst sentiment (recent positive net revisions to EPS estimates), an attractive forward P/E of 11.9x, good projected EPS growth (16.9%), and a low forward PEG (forward P/E divided by projected EPS growth rate) of 0.70. Energy enjoys strong analyst sentiment, the strongest insider sentiment, an attractive forward P/E of 13.5, stellar projected EPS growth (29.8%), and the lowest forward PEG of only 0.45. I can’t emphasize enough how low that is compared to many prior years of rankings. After dwelling in or near the cellar for much of the past few years, Energy has been climbing the rungs this year and is now firmly entrenched at the top as much as it was previously entrenched at the bottom for all that time – particularly with oil above $80 and rising. Rounding out the top five are Financial, Technology, and Healthcare – a bullish top 5 indeed.
2. At the bottom are Consumer Services (Discretionary/Cyclicals) and Industrial with Outlook scores of 30 and 31, respectively. However, it is worth noting that the bottom four, which also include defensive sectors Consumer Goods (Staples/Noncyclicals) and Utilities, are tightly bunched with Outlook scores in the 30’s. Consumer Services and Industrial are in the cellar primarily due to having negative earnings revisions and high forward P/Es of 25.8x and 23.7x, respectively.
3. Looking at the Bull scores, Energy has the top score of 68, followed by Financial at 58, as stocks within these sectors have displayed relative strength on strong market days. Utilities scores the lowest at 30. The top-bottom spread is an incredibly high 38 points, which reflects low sector correlations on strong market days. It is desirable in a healthy market to see low correlations reflected in a top-bottom spread of at least 20 points, which indicates that investors have clear preferences in the market segments and stocks they want to hold.
4. Looking at the Bear scores, Utilities and Consumer Goods score the highest of 54, as stocks within these defensive sectors have been the preferred safe havens on weak market days. Industrial, Telecom, Financial, and Technology all display the lowest score of 44, as investors have fled the sector during market weakness. The top-bottom spread is only 10 points, which reflects rather high sector correlations on weak market days. Ideally, certain sectors will hold up relatively well while others are selling off (rather than broad risk-off behavior), so it is desirable in a healthy market to see low correlations reflected in a top-bottom spread of at least 20 points.
5. Basic Materials displays the best all-around combination of Outlook/Bull/Bear scores, while Utilities is the worst. Looking at just the Bull/Bear combination, Energy displays by far the highest score, indicating superior relative performance (on average) in extreme market conditions whether bullish or bearish, while Utilities scores the worst.
6. This week’s fundamentals-based Outlook rankings display a solidly bullish bias given that the top 5 sectors are considered either cyclical (i.e., highly economically sensitive) or all-weather, while the more defensive sectors are relegated towards the bottom. Keep in mind, the Outlook Rank does not include timing, momentum, or relative strength factors, but rather reflects the consensus fundamental expectations at a given point in time for individual stocks, aggregated by sector.
ETF Trading Ideas:
Our Sector Rotation model, which appropriately weights Outlook, Bull, and Bear scores in accordance with the overall market’s prevailing trend (bullish, neutral, or defensive), continues to display a bullish bias and suggests holding Energy (IYE), Basic Materials (IYM), and Financial (IYF), in that order. (Note: In this model, we consider the bias to be bullish from a rules-based trend-following standpoint when SPY is above both its 50-day and 200-day simple moving averages.)
If you prefer a neutral bias, the Sector Rotation model suggests holding Basic Materials, Energy, and Financial, in that order. Or, if you are more comfortable with a defensive stance, the model suggests holding Utilities, Consumer Goods (Staples/Noncyclicals), and Basic Materials, in that order.
An assortment of other interesting ETFs that are scoring well in our latest rankings include VanEck Vectors Steel (SLX), First Trust Indxx Global Natural Resources Income (FTRI), Invesco DWA Financial Momentum (PFI), Alpha Architect US Quantitative Value (QVAL), Fidelity Stocks for Inflation (FCPI), ETFMG Treatments Testing and Advancements (GERM), iShares MSCI Global Energy Producers (FILL), Avantis US Small Cap Value (AVUV), Invesco DWA Basic Materials Momentum (PYZ), First Trust Dorsey Wright Momentum & Value (DVLU), SPDR S&P Global Natural Resources (GNR), iShares US Oil & Gas Exploration & Production (IEO), Affinity World Leaders Equity (WLDR), Invesco S&P Small Cap Energy (PSCE), First Trust Materials AlphaDEX (FXZ), First Trust Nasdaq Semiconductor (FTXL), Invesco S&P Small Cap Value with Momentum (XSVM), iShares Genomics Immunology and Healthcare (IDNA), and Global X Blockchain (BKCH).
By the way, Sabrient’s new Q4 2021 Baker’s Dozen launches on Wednesday, 10/20/21. As a reminder, our newer portfolios – including Baker’s ...
more

