
No need to fear the bear if you're protected.
Fear & Greed Index Whiffs
The Fear & Greed Index incorporates seven factors to measure market sentiment: junk bond demand, market momentum, market volatility, safe haven demand, stock price strength, put and call options, and stock price breadth. Last Monday, the Fear & Greed Index hit the "extreme fear" level it signaled before the market crash in early 2020.
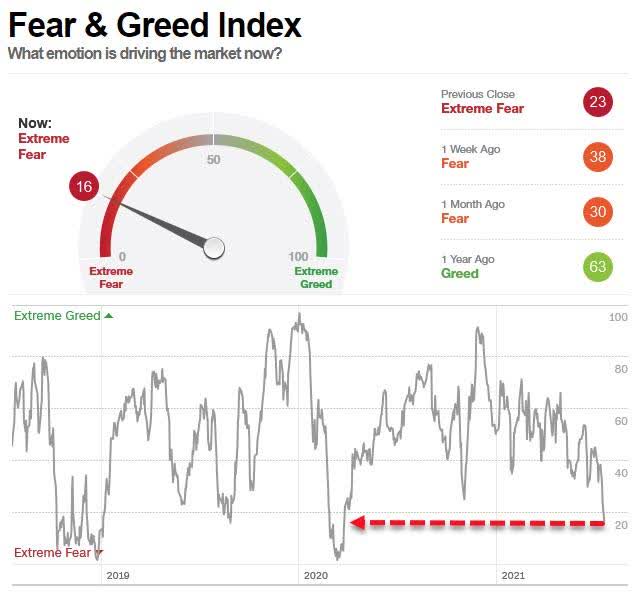
Despite the Sturm und Drang, the major indexes closed at record highs at the end of the week. Let's look at few different ways you could have reacted to the Fear & Greed Index last Monday, and where you'd be now.
Two Responses To Extreme Fear
Let's say you put everything in the SPDR S&P 500 ETF (SPY) at the close on Monday. If the Fear & Greed Index had correctly signaled a crash then, you would have had a problem, but as it happened, you were up about 3.5% on the week.
What if you moved everything to gold instead, using the Sprott Physical Gold Trust (PHYS)? You would have been down fractionally on the week. You would have had a similar result if you had used the SPDR Gold Trust (GLD) instead.
A Third Response To Extreme Fear
Last week, we mentioned another approach: buy likely winners and hedge away the fear (to be precise: buy likely winners that are relatively cheap to hedge).
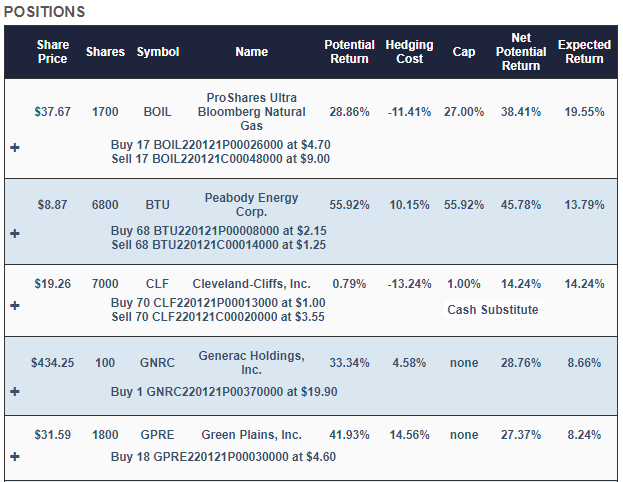
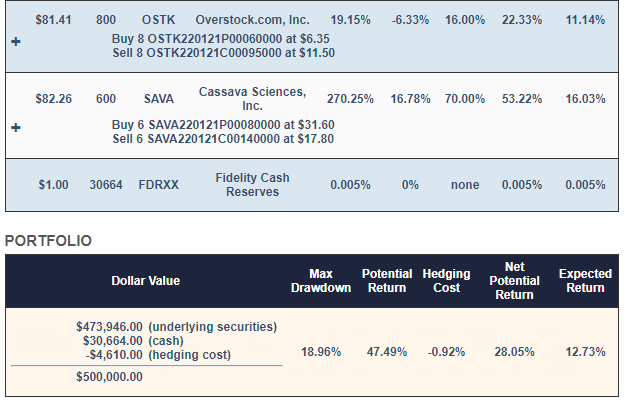
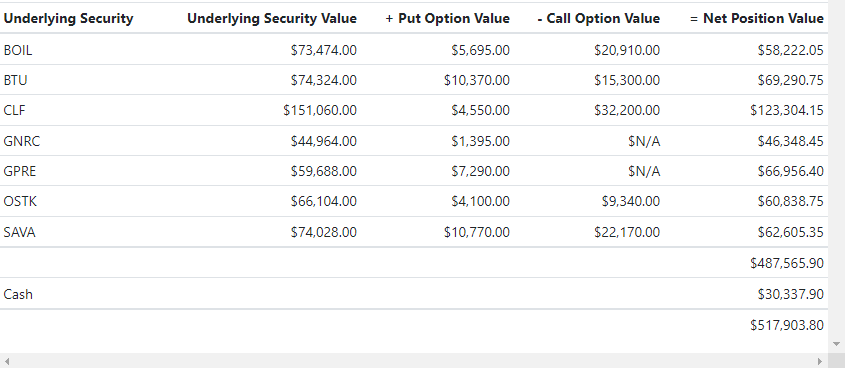
The likely winners our system came up with last Monday were the ProShares Ultra Bloomberg Natural Gas ETF (BOIL), Peabody Energy (BTU), Generac Holdings (GNRC), Green Plains (GPRE), Overstock.com (OSTK), and Cassava Sciences (SAVA). For an investor with $500,000 who was unwilling to risk a decline of more than 20% in the event of a market crash or bear market, our system started with roughly equal dollar amounts of each of those names, and then rounded them down to round lots, to reduce hedging costs. It swept up most of the leftover cash from the rounding-down process into a tightly hedged Cleveland-Cliffs (CLF) position, to further reduce hedging cost.
That hedged portfolio looked like this:
Screen captures via Portfolio Armor on 7/19/2021
Why Those Hedges?
If you click the plus signs in the portfolio above on our website, the positions expand to give you a better look at the hedges. For example, this is what the GNRC position looked like expanded.
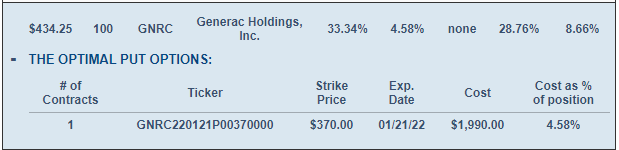
GNRC was hedged with an optimal, or least expensive, put option. Most of the other positions are hedged with optimal collars. Our system estimates returns both ways to determine which type of hedge is best. We elaborated on that process in a previous post: When To Hedge With Puts Versus Collars.
How That Portfolio Performed Last Week
Basically, in line with the market.
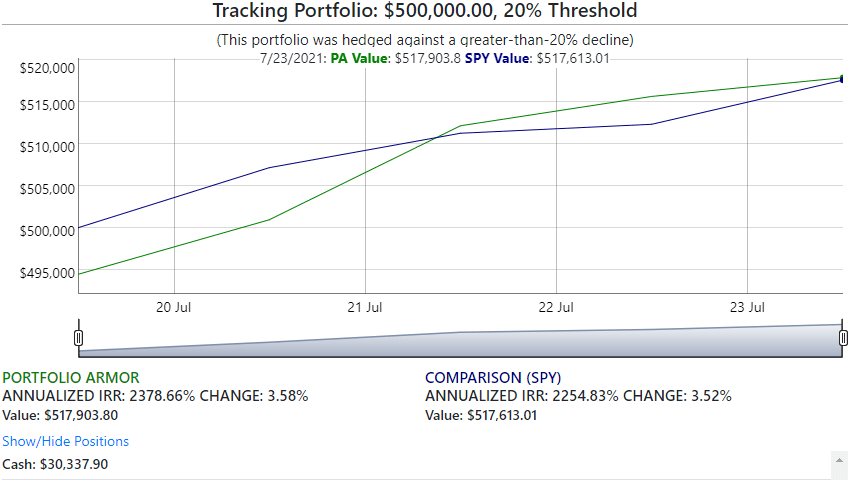
To be conservative, our performance tracking program assumes you entered all the hedges at the worst ends of their spreads, and then it values the options at the midpoint of the bid-ask. That's why our portfolio (the green line) starts in the hole about 1.1%. Nevertheless, by the end of the week, net of trading costs, it was ahead of SPY by 6 basis points.
The Fear & Greed Index Will Be Right Again
The point of this post isn't to preach complacency: just because the Fear & Greed Index whiffed last Monday, doesn't mean it won't be right next time it hits "extreme fear". The point is that if you buy and hedge and handful of promising names, you can have a shot at making money if the market continues to go up, while being protected when the Fear & Greed Index gets it right next time.


Comments
Log in or sign up to join the conversation.