
Deep-Value ETF Report - Tuesday, Jan. 31
The energy sector has been red-hot for much of the past year, but there are still pockets in this corner that remain battered, at least in relative terms. Notably, oil and gas equipment stocks remain deep in the red in absolute and relative terms, based on relative rankings for a set of 145 ETFs that cover the waterfront for the major asset classes.
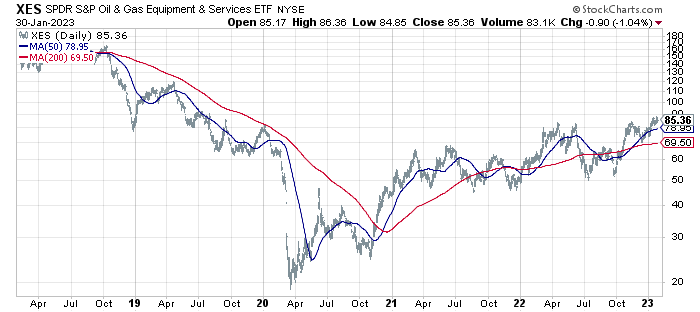
SPDR S&P Oil & Gas Equipment & Services ETF (XES) has certainly rallied sharply since it was crushed in the pandemic crash of 2020. But on a trailing 5-year basis the ETF remains one of the hardest-hit funds, sinking more than 13% on an annualized total-return basis. That compares with a solid five-year gain for energy stocks overall: Energy Select Sector SPDR Fund (XLE) is up 8.1% a year since 2018.
Why the focus on 5-year return? It’s a useful proxy for estimating the relative strength or weakness of the value factor on a prospective basis. The idea is outlined in a paper by AQR Capital Management’s Cliff Asness and two co-authors: “Value and Momentum Everywhere,” published in a 2013 issue of the Journal of Finance. There are numerous value metrics and so no one should confuse the 5-year-performance benchmark as the definitive measure of bargain-priced assets. But as a starting point in the process of identifying where the crowd’s expectations have stumbled (or at least lag in relative terms), the 5-year change has appeal.
One advantage of using a 5-year performance measure: It can be applied over a broad set of assets, thereby leveling the playing field for evaluating this risk factor. Another plus: the methodology is simple and intuitive, all but eliminating estimation risk, which can complicate accounting-based value gauges, such as price-to-book and price-to-earnings measures. In short, the 5-year return is a handy tool as a first approximation for identifying ETFs that appear to be deeply discounted by the crowd, which may indicate relatively high expected returns via the value proposition for investing.
As always, there are no guarantees that the so-called value premium, no matter the definition, will generate superior performance anytime soon, if ever. Using estimates of value is a tool for forecasting, so all the usual caveats apply. Recent history certainly leaves plenty of room for caution in this realm, offset at times with periods of encouragement. The good news: kicking the tires is still a risk-free proposition.
The ranking below covers 145 exchange-traded products that run the gamut: US and foreign stocks, bonds, real estate, commodities and currencies. You can find the full list here, sorted in ascending order by annualized 5-year return — 1260 trading days — through yesterday’s close (Jan. 30, 2023).
As a starting point, let’s begin with the major asset classes. The first takeaway: there’s still a fair amount of red ink spread across global markets. The weakest performer, which implies the deepest value in relative terms: corporate bonds ex-US (PICB). By contrast, US stocks (VTI) are still the poster boy for anti-value.

Ranking the deepest value candidates for the full list continues to show a set of funds that have been regular denizens of the bottom ranks in recent years. That includes oil and gas equipment services (XES). That’s not to say that XES hasn’t enjoyed the risk-on sentiment that’s lifted the energy sector. But relative to its peers, XES’s rally has been modest – a reminder that the appearance of deep value isn’t always a short cut to outsized gains.

More By This Author:
U.S. Real Estate Stocks Led Broad Rally Across Markets Last Week
Is US Recession Risk High, Low… Or Both?
Is Rally In Communications Stocks A Sign Of New Sector Leadership?
Disclosures: None.


