
SPX Monitoring purposes; long SPX on 10/10/22 at 3612.39; sold 12/13/22 at 3669.91 = gain 1.59%.
Monitoring purposes GOLD: Long GDX on 10/9/20 at 40.78.
Long Term SPX monitor purposes; Neutral
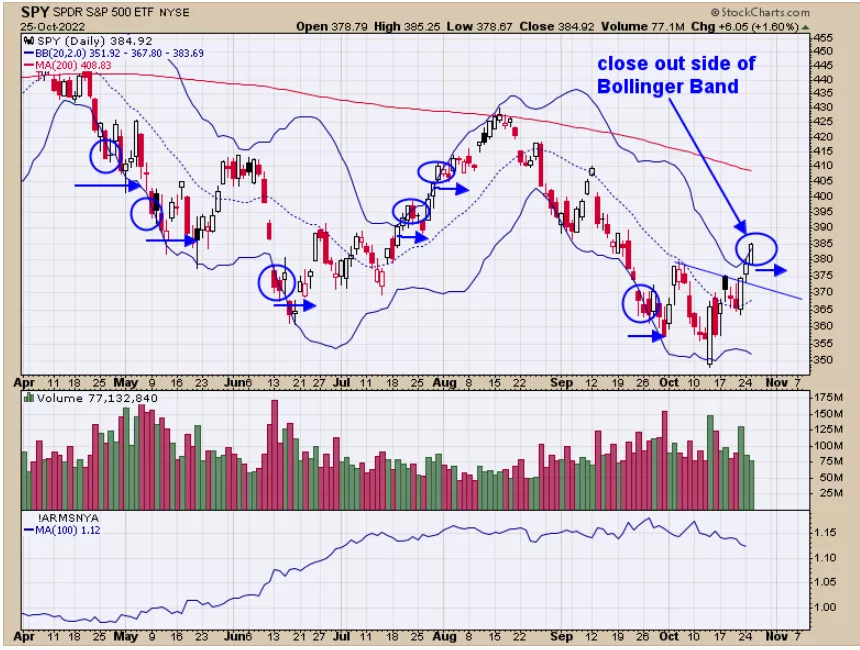
The top window is the SPY with its Bollinger Bands. It is common for the SPY to stall when the market closes above its Upper (Lower) Bollinger bands and today's trading, did just that. We circled in blue the times when SPY closed beyond its outer Bollinger Band and the market usually flipped sideways for several days. The next Fed meeting is November 2 (one week and one day away) and the Election is November 8 (two weeks away). Could see backing and fill into those timeframes but the ultimate outcome is a rally into yearend. There is evidence that the October 13 low may have been the bottom.
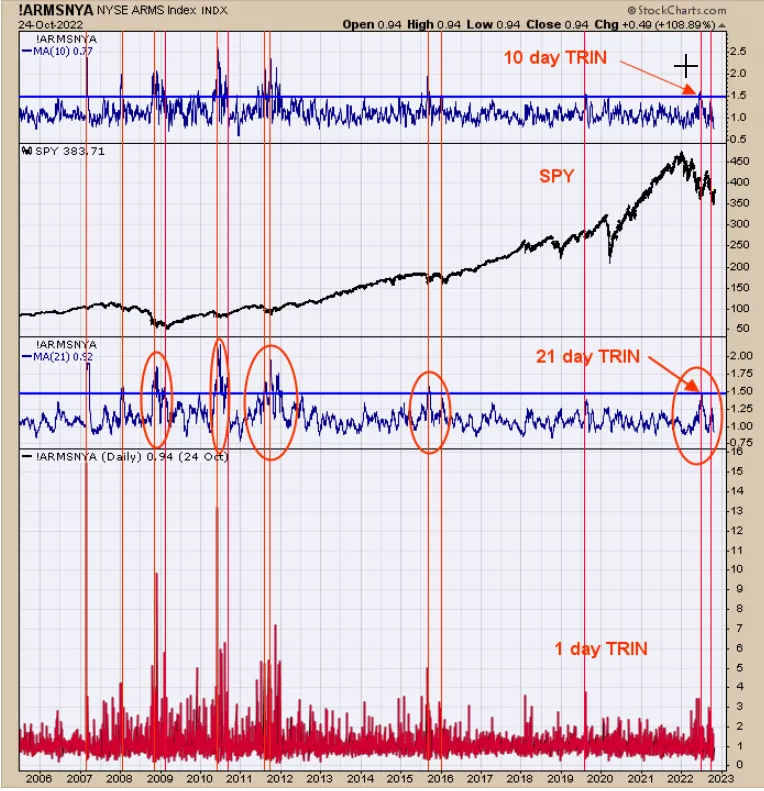
Looking at a lot of different studies, we come to the conclusion that the October 13 low was probably the bottom (could be wrong). The top window is the 10-day average of the trin close. There were two times when the 10-day trin reached above 1.50; which were June 13 to 21 and September 26. Looking back in history it is common for the 10-day trin to reach 1.50 range twice and the second time usually finishes the consolidation. The 21-day trin also plays a part and it adds to the bottom process when this indicator reaches 1.50; which it did on July 11. Yesterday we said, “The next Fed meeting is November 2 and the Election is November 8. Could see backing and fill into those timeframes but the ultimate outcome is a rally into yearend.”
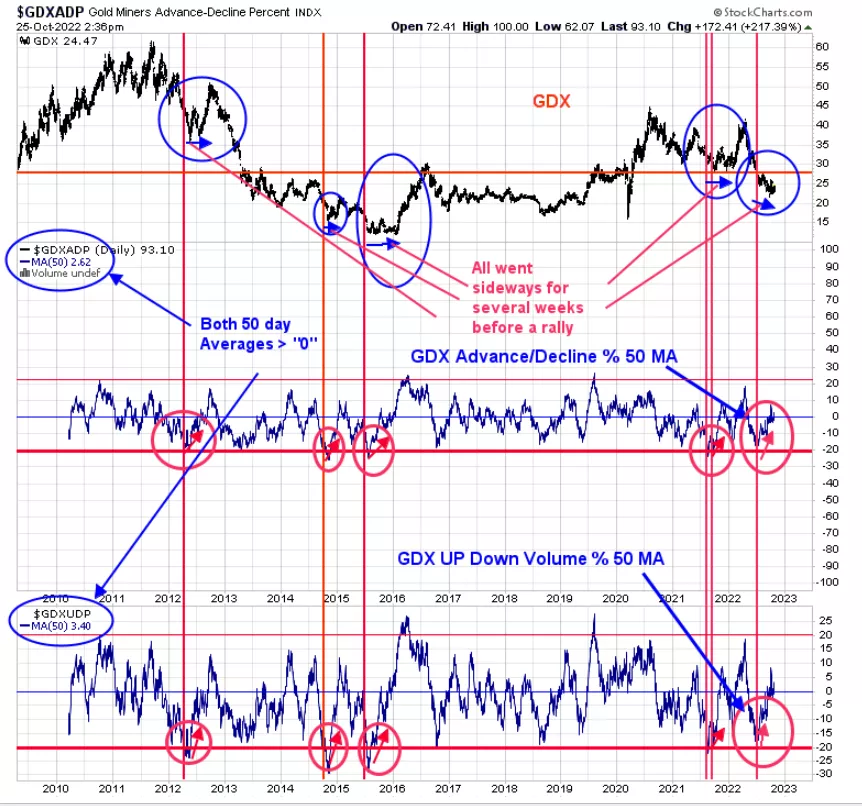
The above chart shows the shorter-term picture for GDX. The bottom window is the 50-day average of the Up Down volume percent for GDX and the next window up is the 50-day average of the Advance/Decline percent for GDX. Intermediate-term lows have formed when both indicators reach -20 and then turn up. After this type of signal is triggered the market usually moves sideways for several weeks before the rally actually starts. The current signal was triggered in mid-July and the current price in GDX is about where the mid-July price is, so the market really hasn’t moved. Since the mid-July low both indicators have been hovering around “0” up from the -20 form the July low showing a positive divergence. In general, we are expecting both indicators to move higher into the +20 range in the coming weeks and for GDX to move up along with both indicators.
More By This Author:
“Sign Of Strength”
Longer-Term Bullish Setup
Option Expiration Next Week


Comments
Log in or sign up to join the conversation.