
SPX Monitoring purposes; long SPX on 10/10/22 at 3612.39
Monitoring purposes GOLD: Long GDX on 10/9/20 at 40.78.
Long Term SPX monitor purposes; Neutral
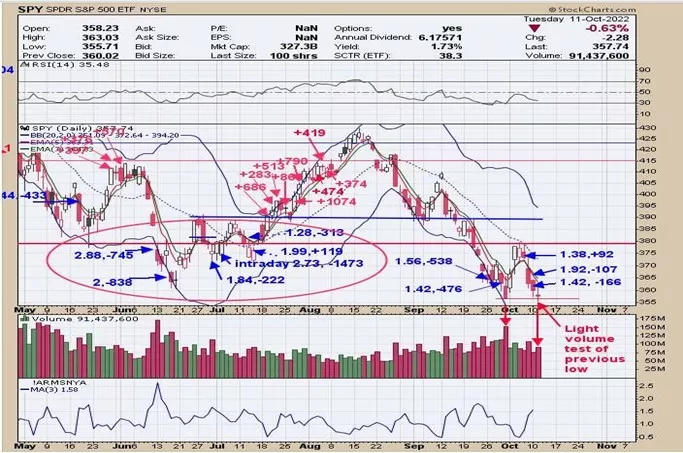
We updated this chart from yesterday, we said yesterday, “The blue numbers next to the candles are the trin close (first number) and tick close (the second number). A trin close above 1.30 and a tick close below -300 (within a day of a trin close above 1.30) have been a bullish sign short term for the SPX (SPY). Notice that there are a lot of bullish trin and tick readings around current levels suggesting support. This is the week before option expiration week when whipsaws are common. There could be backing a filling short term but panic readings are present on the trin and tick suggesting support near current prices.” Added to the above, today’s trade tested the previous low of 9/30 on lighter volume and suggests support. The market should at least bounce from here and the type of bounce will tell how strong the market is.
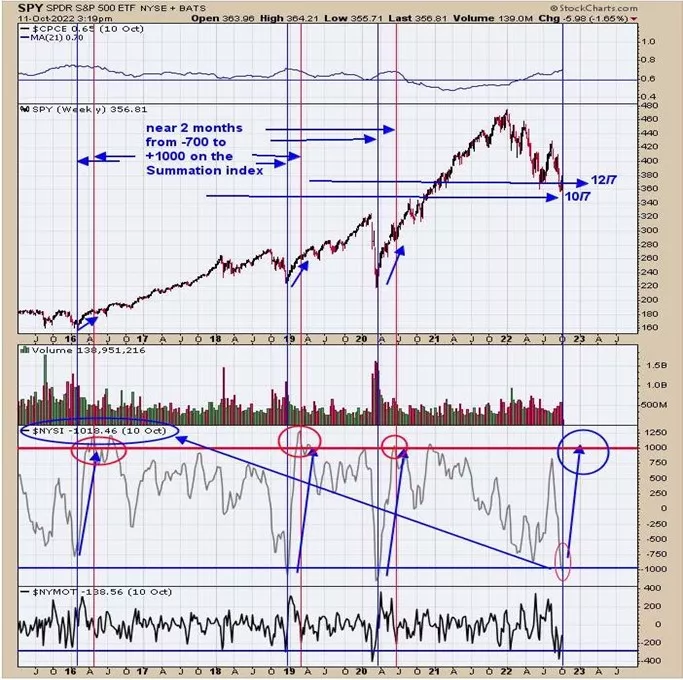
Yesterday we said, “The bottom window is the NYSE McClellan Oscillator; readings below -400 appear near intermediate-term lows. September 26 the McClellan Oscillator closed at -426. The next window up is the NYSE McClellan Summation index. Intermediate-term lows have formed with the Summation index closed below -700; Friday’s reading came in at minus 974. SPX appears near a worthwhile low. The next rally will tell a lot about what the underlining strength is. If the Summation index can get back to +1000 near December 7, that would bode well for the intermediate term. If the Summation index fell to reach +1000 by December 7, then most likely more work of back and filling or worst, will be needed.” We updated this chart to the current data. The NYSE Summation index closed yesterday at -1018 and well below -700 suggesting a sold-out market, -1000 is as low as it usually gets.
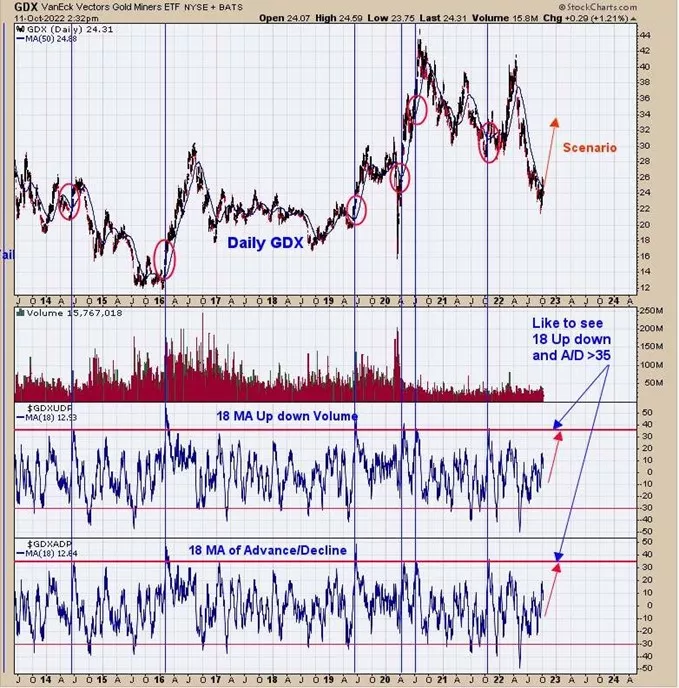
There is evidence from several different indicators that GDX (XAU and HUI) are making a low in this area. What we like to see now is a “Sign of Strength” (SOS) in GDX. One way for an SOS to appear is for both the 18-day averages of the Advance/Decline percent and Up down volume percent (bottom two windows) to reach +35 ranges in the coming days. In previous times both indicators reached +35 (noted with red circles on GDX) the market went on to hit higher highs. The potential rally could lead to a long-term rise.
More By This Author:
Longer-Term Bullish Setup
Option Expiration Next Week
“Selling Climax” Day


Comments
Log in or sign up to join the conversation.