
SPX Monitoring purposes; long SPX on 11/10/22 at 3956.27
Monitoring purposes GOLD: Long GDX on 10/9/20 at 40.78.
Long Term SPX monitor purposes; Neutral
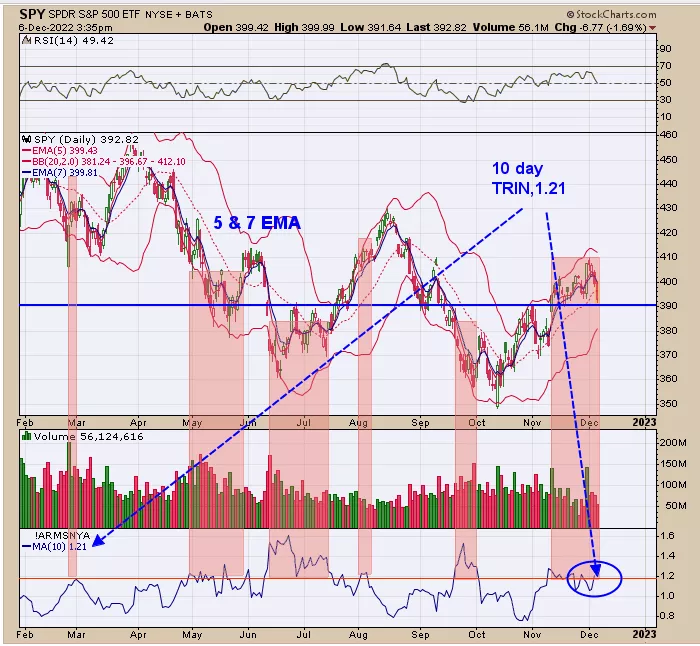
Yesterday we said, “The 10-day average of the Trin close near 1.20 appears near short-term lows. The bottom window is the 10-day average of the trin close. Readings near 1.20 and higher are usually a bullish sign for the market and below .80 is a bearish sign. We shaded in the times when the 10-day TRIN came in near 1.20 and higher and the market is in that region now. Today’s TRIN close reaching panic levels helping to push the 10-day TRIN back into bullish levels.” The 10-day TRIN closed yesterday at 1.21; also the TRIN closed yesterday at 2.33 and the tick at -255 which is a bullish combination suggests a low the same day as the reading to as late as two days later which would be tomorrow the “full moon” day. Should be near a low at current prices.
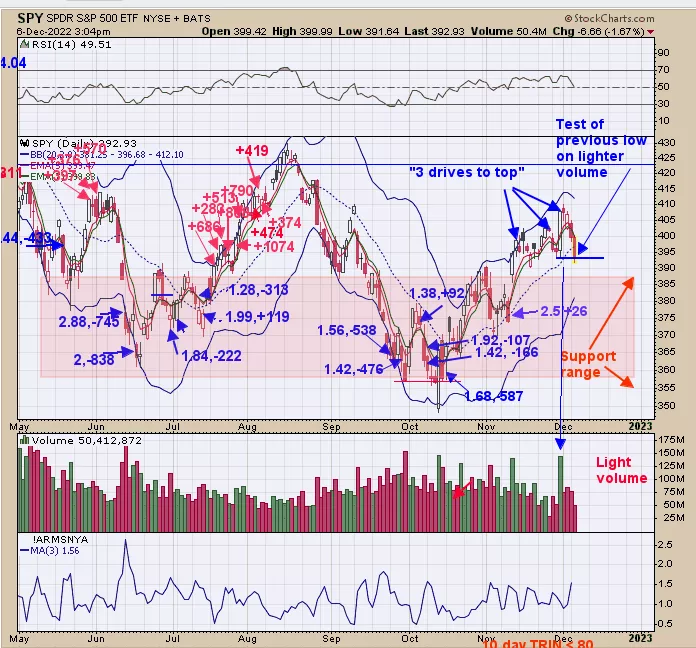
Yesterday we said, “December 7 is also a Full Moon day; Full moon periods can affect the market short term. This time around it may mark a low.” Judging by the trin closes there is enough panic to suggest a low around current prices. The pattern that appears to have formed is a “Three Drives to Top” (noted on the chart) which has a downside target to where the pattern began which is near current prices. Last Wednesday has a huge volume and today’s prices are testing that level now on a much lighter volume which suggests support. The short-term pullback appears done and another rally phase may begin shortly.
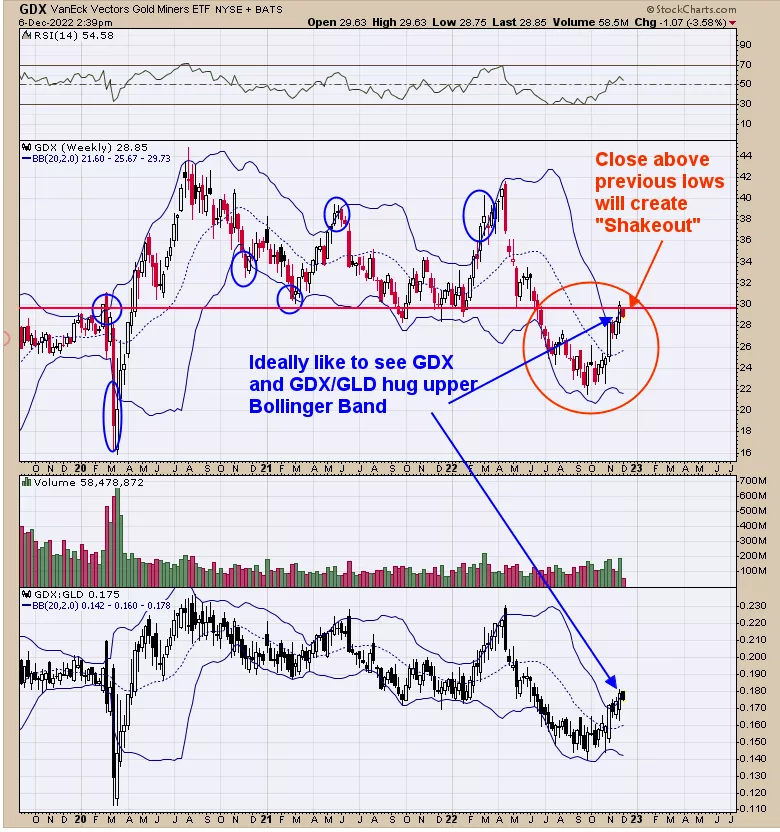
Above is the weekly GDX. Back in June GDX fell below the previous lows near 30 and since then the market has rallied back to the 30.00 range. If GDX manages to close above 30.00 in the coming weeks (which we think it will) it will create a “Shakeout”. A “Shakeout” is when the market fails to hold below the previous lows and if the market can’t hold below the previous low, it will reverse and attempt to take out the previous highs. The previous high in this case is the April high near 42.00. The weekly GDX is above its mid-Bollinger band and the mid-Bollinger band is now rising and the weekly RSI is above 50; both of which are bullish. Notice also that GDX is hugging the upper weekly Bollinger bands and not backing away suggesting a trending market may have begun. The bigger picture remains bullish.
More By This Author:
November: The Most Bullish Month Of The Year
Bollinger Bands
“Sign Of Strength”


Comments
Log in or sign up to join the conversation.