
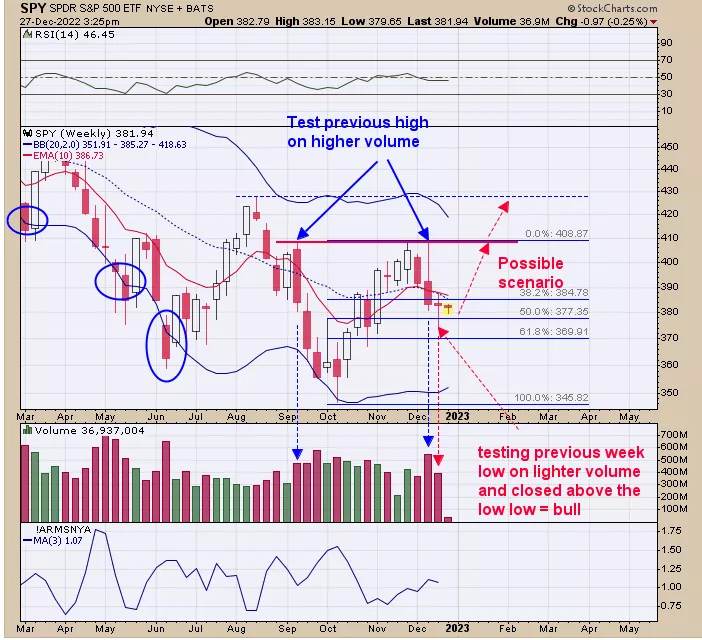
Last week's trading traded below last week's low on lighter volume and then closed above last week's low. It is said, “If a market can’t take out the previous low will higher volume it will reverse and attempt to take out the previous high.” In the current situation, this would give a target for the week of December 16 high near 410 on the SPY. If the December 16-week high is tested on higher volume then that would give a target to the next higher high, which is the August high near 430. Also notice that the SPY found support near the 50% retracement level from the rally up from early October. This condition suggests the 410 SPY level may be exceeded which opens the door to the 430 spy level which is the August high.
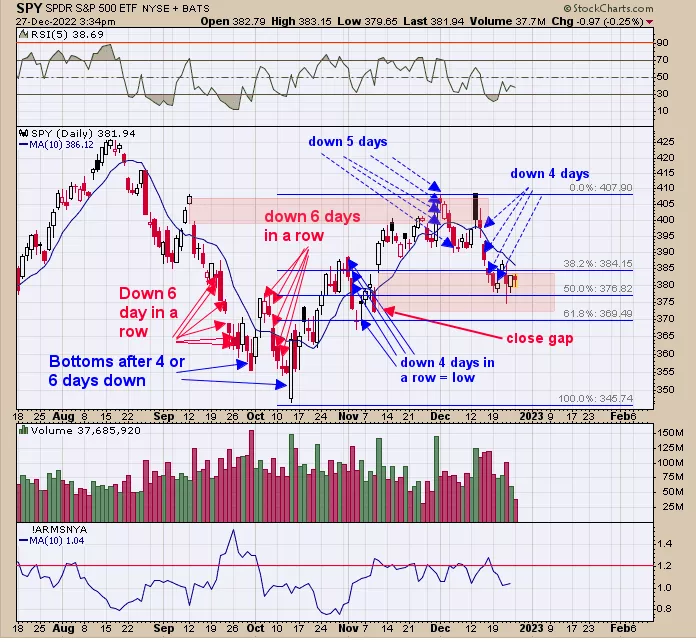
When SPY is down 4 to 6 days in a row, the market can make a lower low before it reverses back up (noted on the chart). SPY has been hovering in November 10 gap since 12/19. November 10 gap has been tested on lighter volume which suggests the gap has support. The weekly chart on page one leans bullish in that last week's tests of the week before lows were on lighter volume which suggests support and gives a target back to the 410 SPY range. Hold long the SPX for now.
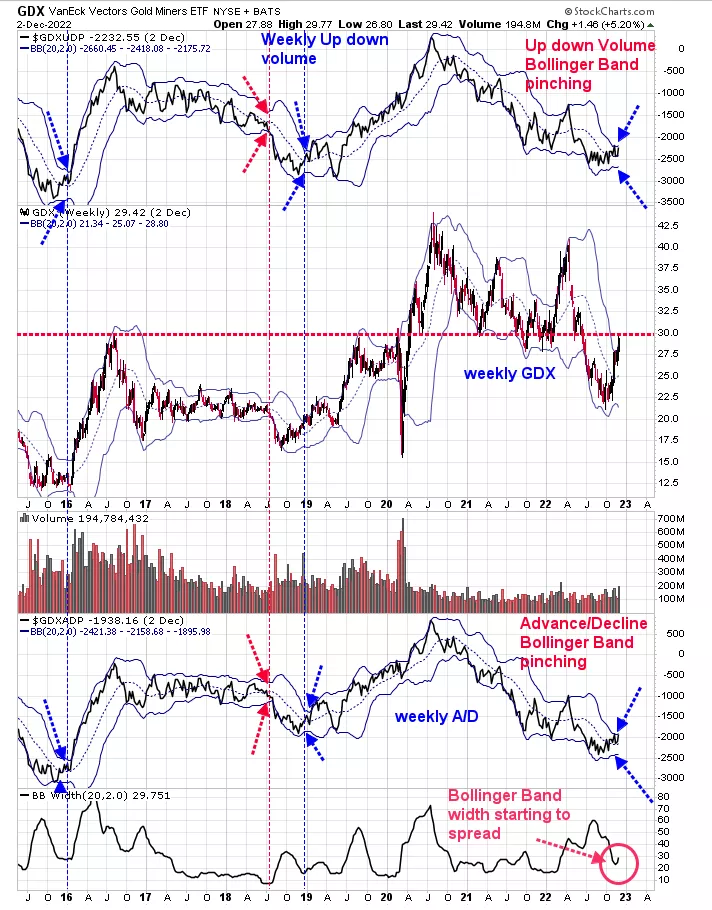
Last Thursday we said, “Both of the weekly 18-day averages of the Up down volume and Advance/Decline indicators Bollinger Bands are pinching suggesting a large move is nearing. We marked with blue and red arrows previous times the Bollinger Bands pinched on these indicators and happen right before large runs in GDX.” The bottom window is the Bollinger Band width; when its low is when the Bollinger bands are at a narrow range and when high is when there are wide apart. When the Bollinger Band width is low and turns up is when large moves can happen. The Bollinger bands have been narrow for several months and are now starting to turn up on these indicators and the indicators are rising suggesting the move will be up. The indicators rally so will GDX.
More By This Author:
A “Shakeout”
November: The Most Bullish Month Of The Year
Bollinger Bands


Comments
Log in or sign up to join the conversation.