
Elliott Wave Technical Analysis: Polkadot/U.S. Dollar - Tuesday, Aug. 15

Image Source: Unsplash
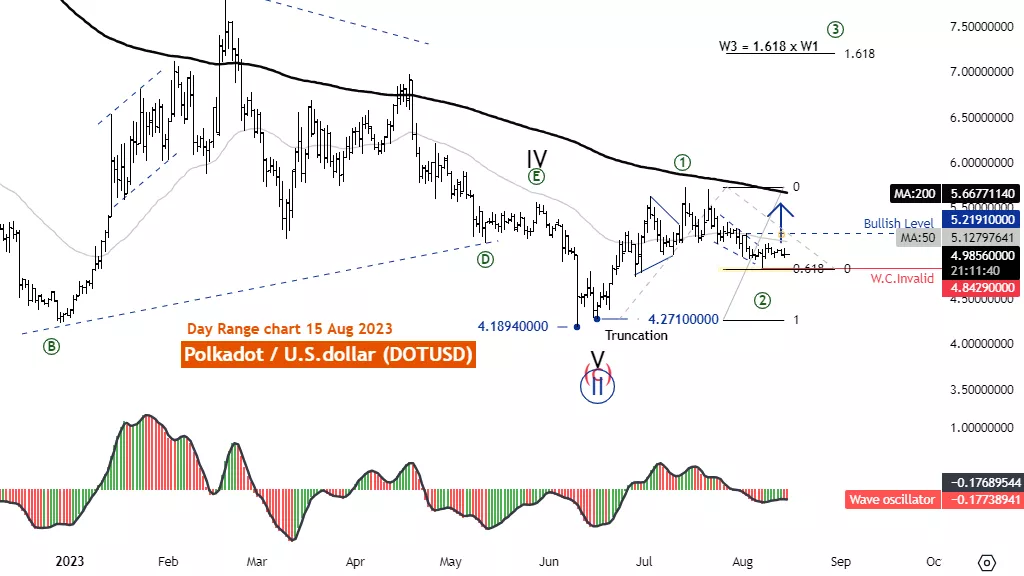
Elliott Wave Analysis TradingLounge Daily Chart, 15 August 2023.
Polkadot/U.S. Dollar(DOTUSD)
DOTUSD Elliott Wave Technical Analysis
Function: Reactionary(Counter Trend)
Mode: Corrective
Structure: Flat
Position: Wave (C)
Direction Next higher Degrees: wave ((2)) of Motive
Details: Retracement of wave ((2)) usually .50 or .618 x Length wave ((1))
Wave Cancel invalid level: 4.26
Polkadot/U.S. Dollar(DOTUSD) Trading Strategy: We considering the Corrective of wave ((2)) green which usually retracement between 50 - 61.8% of Wave ((1)), When wave ((2)) End the price increase again in wave ((3)) and the price rising above 5.219 is a signal for the new uptrend.
Polkadot/U.S. Dollar(DOTUSD) Technical Indicators: The price is below the MA200 indicating a downtrend. Wave oscillator is bearish momentum.
Analyst: Kittiampon Somboonsod, CEWA
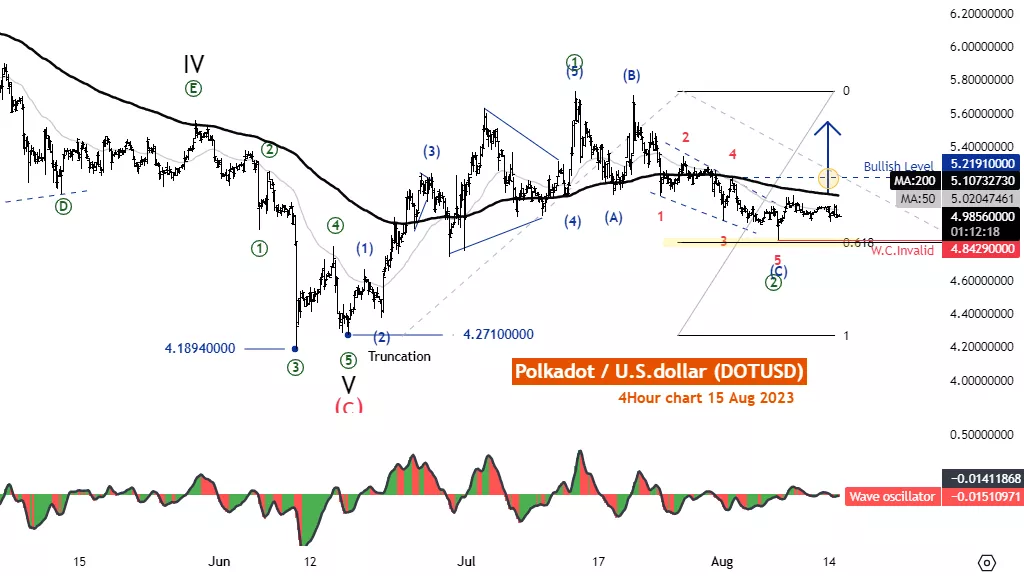
Elliott Wave Analysis TradingLounge 4H Chart, 15 August 2023.
Polkadot/U.S. Dollar(DOTUSD)
DOTUSD Elliott Wave Technical Analysis
Function: Reactionary(Counter Trend)
Mode: Corrective
Structure: Flat
Position: Wave (C)
Direction Next higher Degrees: wave ((2)) of Motive
Details: We are considering ending wave ((2)) from rising above 5.219 level.
Wave Cancel invalid level: 4.842
Polkadot/U.S. Dollar(DOTUSD) Trading Strategy: We considering the Corrective of wave ((2)) green which usually retracement between 50 - 61.8% of Wave ((1)), When wave ((2)) End the price increase again in wave ((3)) and the price rising above 5.219 is a signal for the new uptrend
Polkadot/U.S. Dollar(DOTUSD) Technical Indicators: The price is below the MA200 indicating a downtrend. Wave oscillator is bearish momentum.
More By This Author:
S&P500 Trading Strategy - Elliott Wave Technical Analysis
Elliott Wave Technical Analysis: Vechain/U.S. Dollar - Monday, Aug. 14
Elliott Wave Technical Analysis Lam Research Corp - Monday, August 14
Analyst Peter Mathers TradingLounge™ Australian Financial Services Licence - AFSL 317817


